
twoHelixes
Make graphs about your data with AI
About twoHelixes
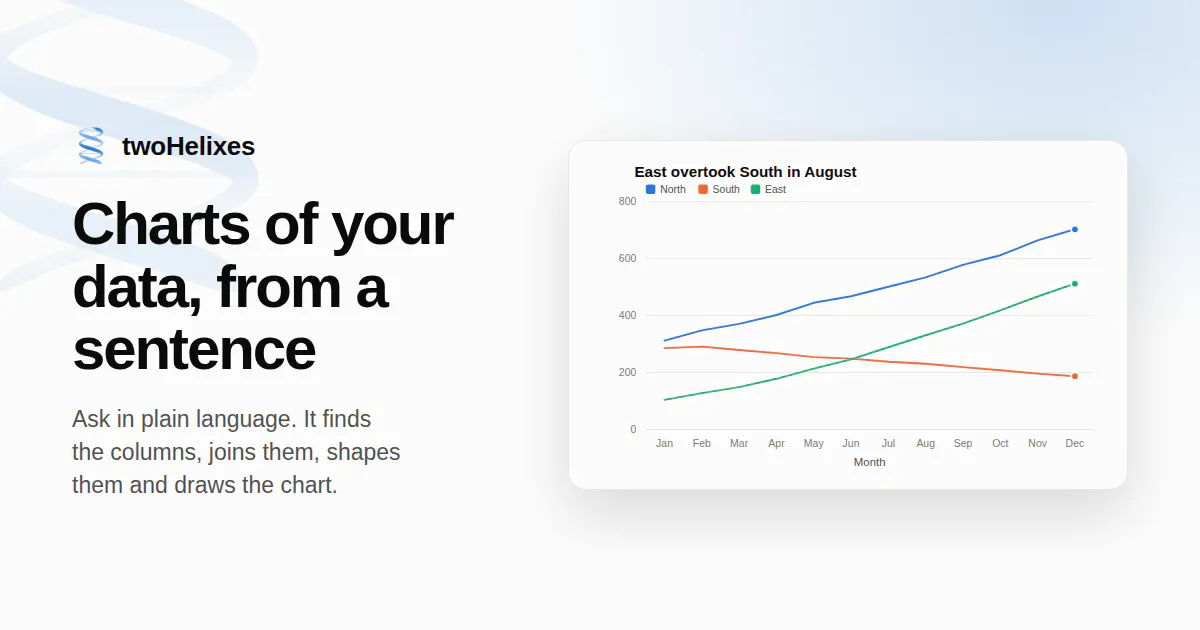
twoHelixes is an innovative AI-powered tool designed for users who need quick, accurate visual representations of their data. Whether working with spreadsheets, databases, or data warehouses, users can simply input their data and receive a clear, professionally formatted graph within seconds. Its core strength lies in its ability to interpret various data sources and generate readable, correct charts with minimal effort, making complex data visualization accessible even for non-experts. Ideal for data analysts, business professionals, or anyone needing rapid insights, twoHelixes streamlines the process of creating compelling visualizations that enhance understanding and decision-making. Its AI-driven approach ensures that charts are not only accurate but also optimized for clarity, saving users valuable time and reducing the need for manual adjustments.
Screenshots
Pros
- ✓Quick and automatic generation of accurate charts from diverse data sources
- ✓User-friendly interface suitable for non-experts
- ✓Supports a wide range of data formats including spreadsheets and databases
- ✓Speeds up data visualization workflows significantly
- ✓AI optimization enhances readability and correctness of graphs
Cons
- ✗Currently lacks extensive customization options for advanced users
- ✗Limited information on pricing and subscription plans
- ✗No detailed tracking of analytics or export formats
Use Cases
Pricing
Likely follows a freemium model, offering basic features for free with premium plans for advanced functionalities, though specific details are not publicly available.
Quick Info
Topics
Makers

Alternatives
Similar Tools in Data & Analytics


Embed Badge
Add this badge to your website to show that twoHelixes is featured on Visalytica.
<a href="https://www.visalytica.com/tool/twohelixes" target="_blank" rel="noopener noreferrer" style="display:inline-flex;align-items:center;gap:6px;padding:6px 14px;background:#7c3aed;color:#fff;border-radius:8px;font-family:-apple-system,system-ui,sans-serif;font-size:13px;font-weight:600;text-decoration:none;transition:background .2s" onmouseover="this.style.background='#6d28d9'" onmouseout="this.style.background='#7c3aed'"><svg width="14" height="14" viewBox="0 0 24 24" fill="none" stroke="currentColor" stroke-width="2.5" stroke-linecap="round" stroke-linejoin="round"><path d="M12 20V10"/><path d="M18 20V4"/><path d="M6 20v-4"/></svg>Featured on Visalytica</a>