
Rival Charts
Create stunning chart races 🚀 📊 that go viral!
About Rival Charts
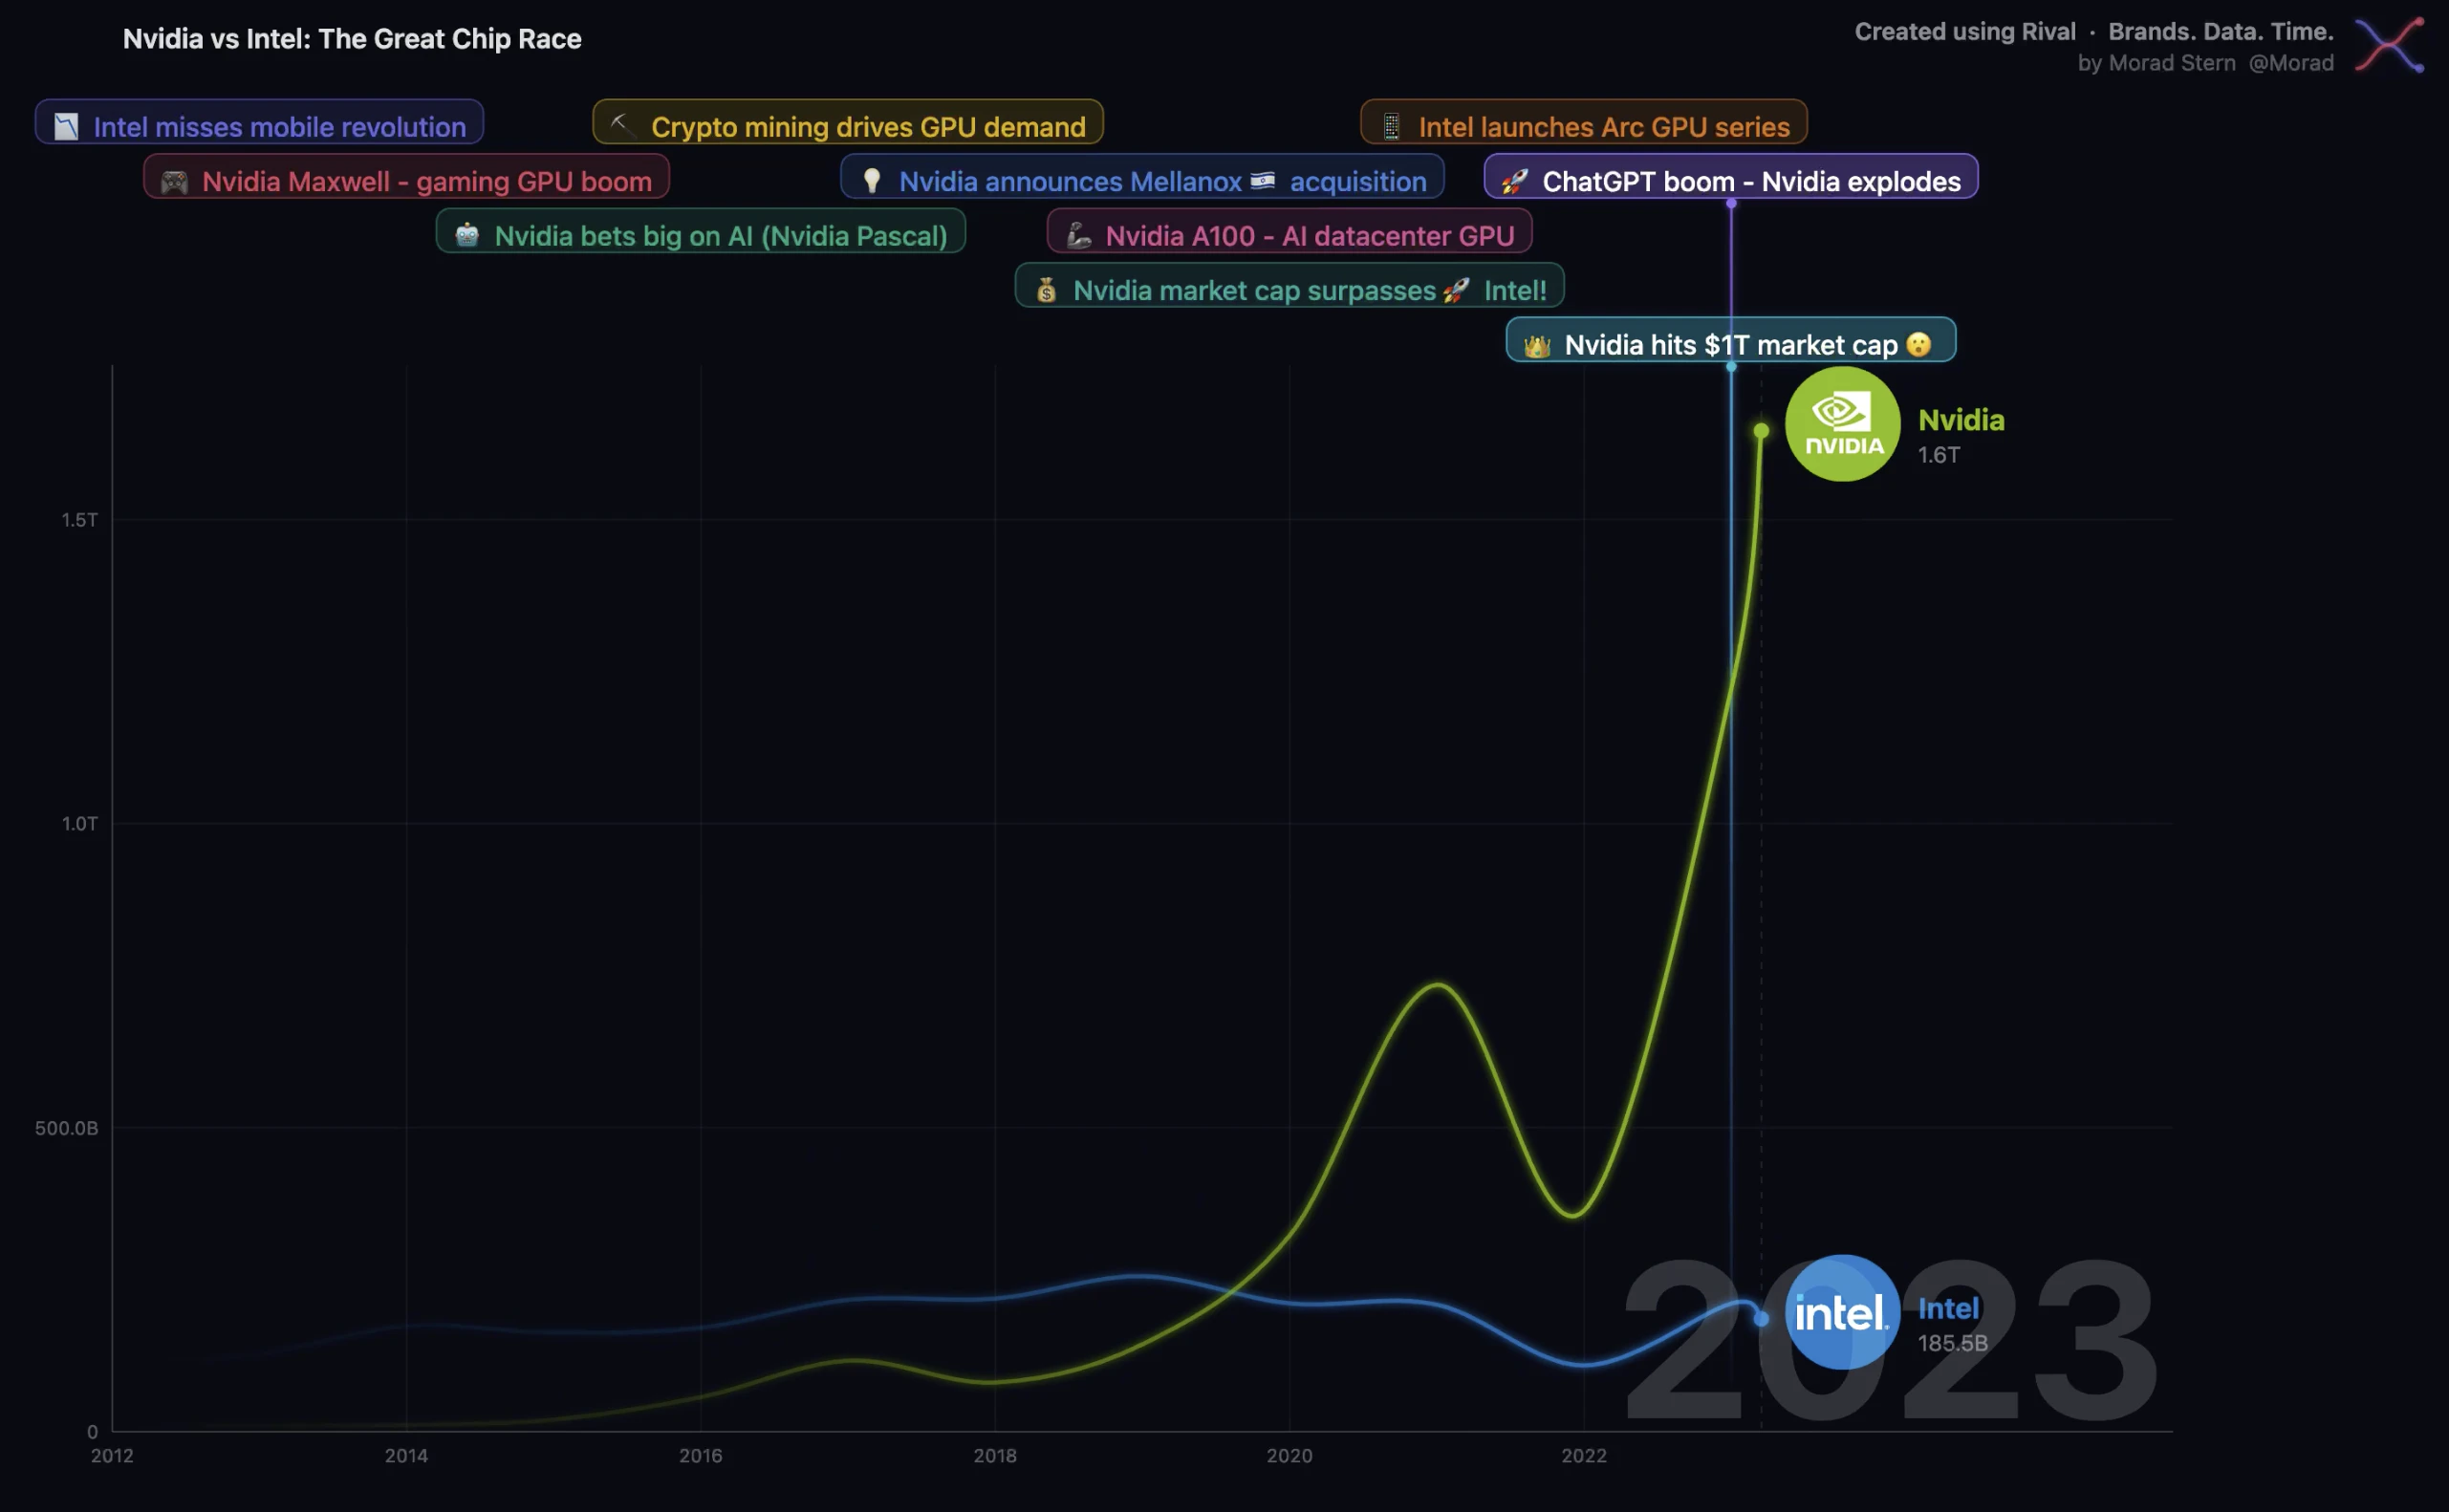
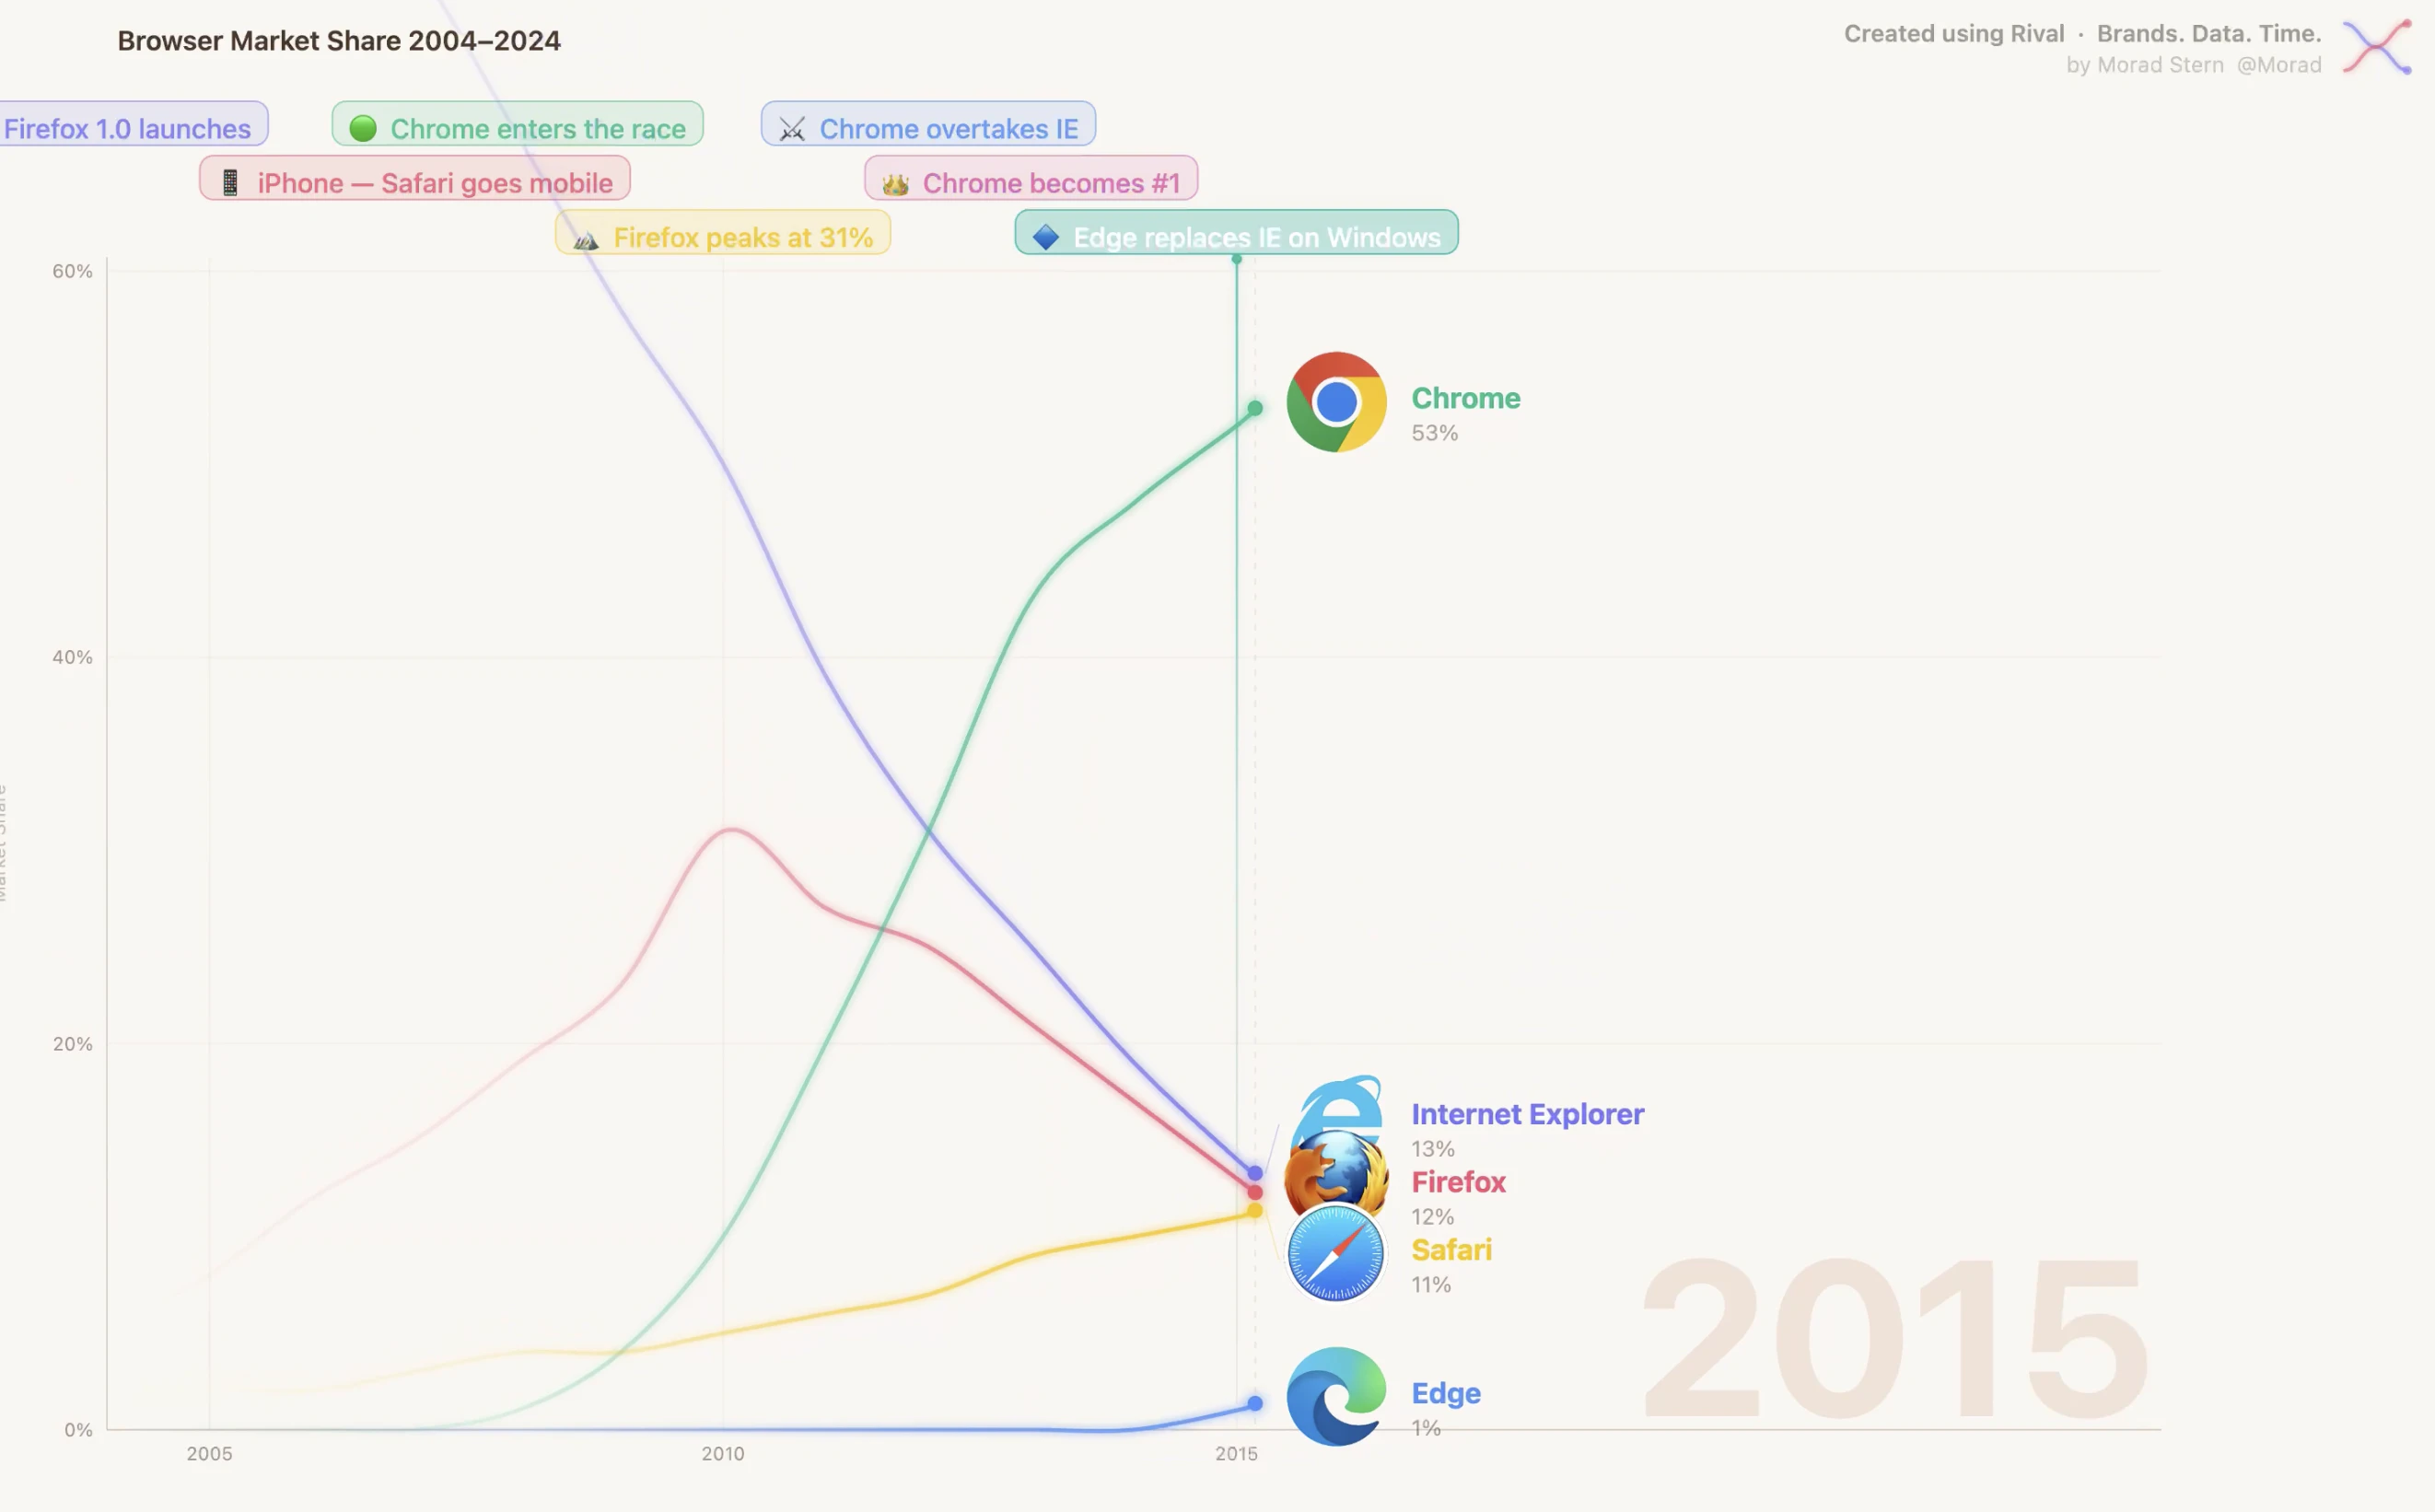
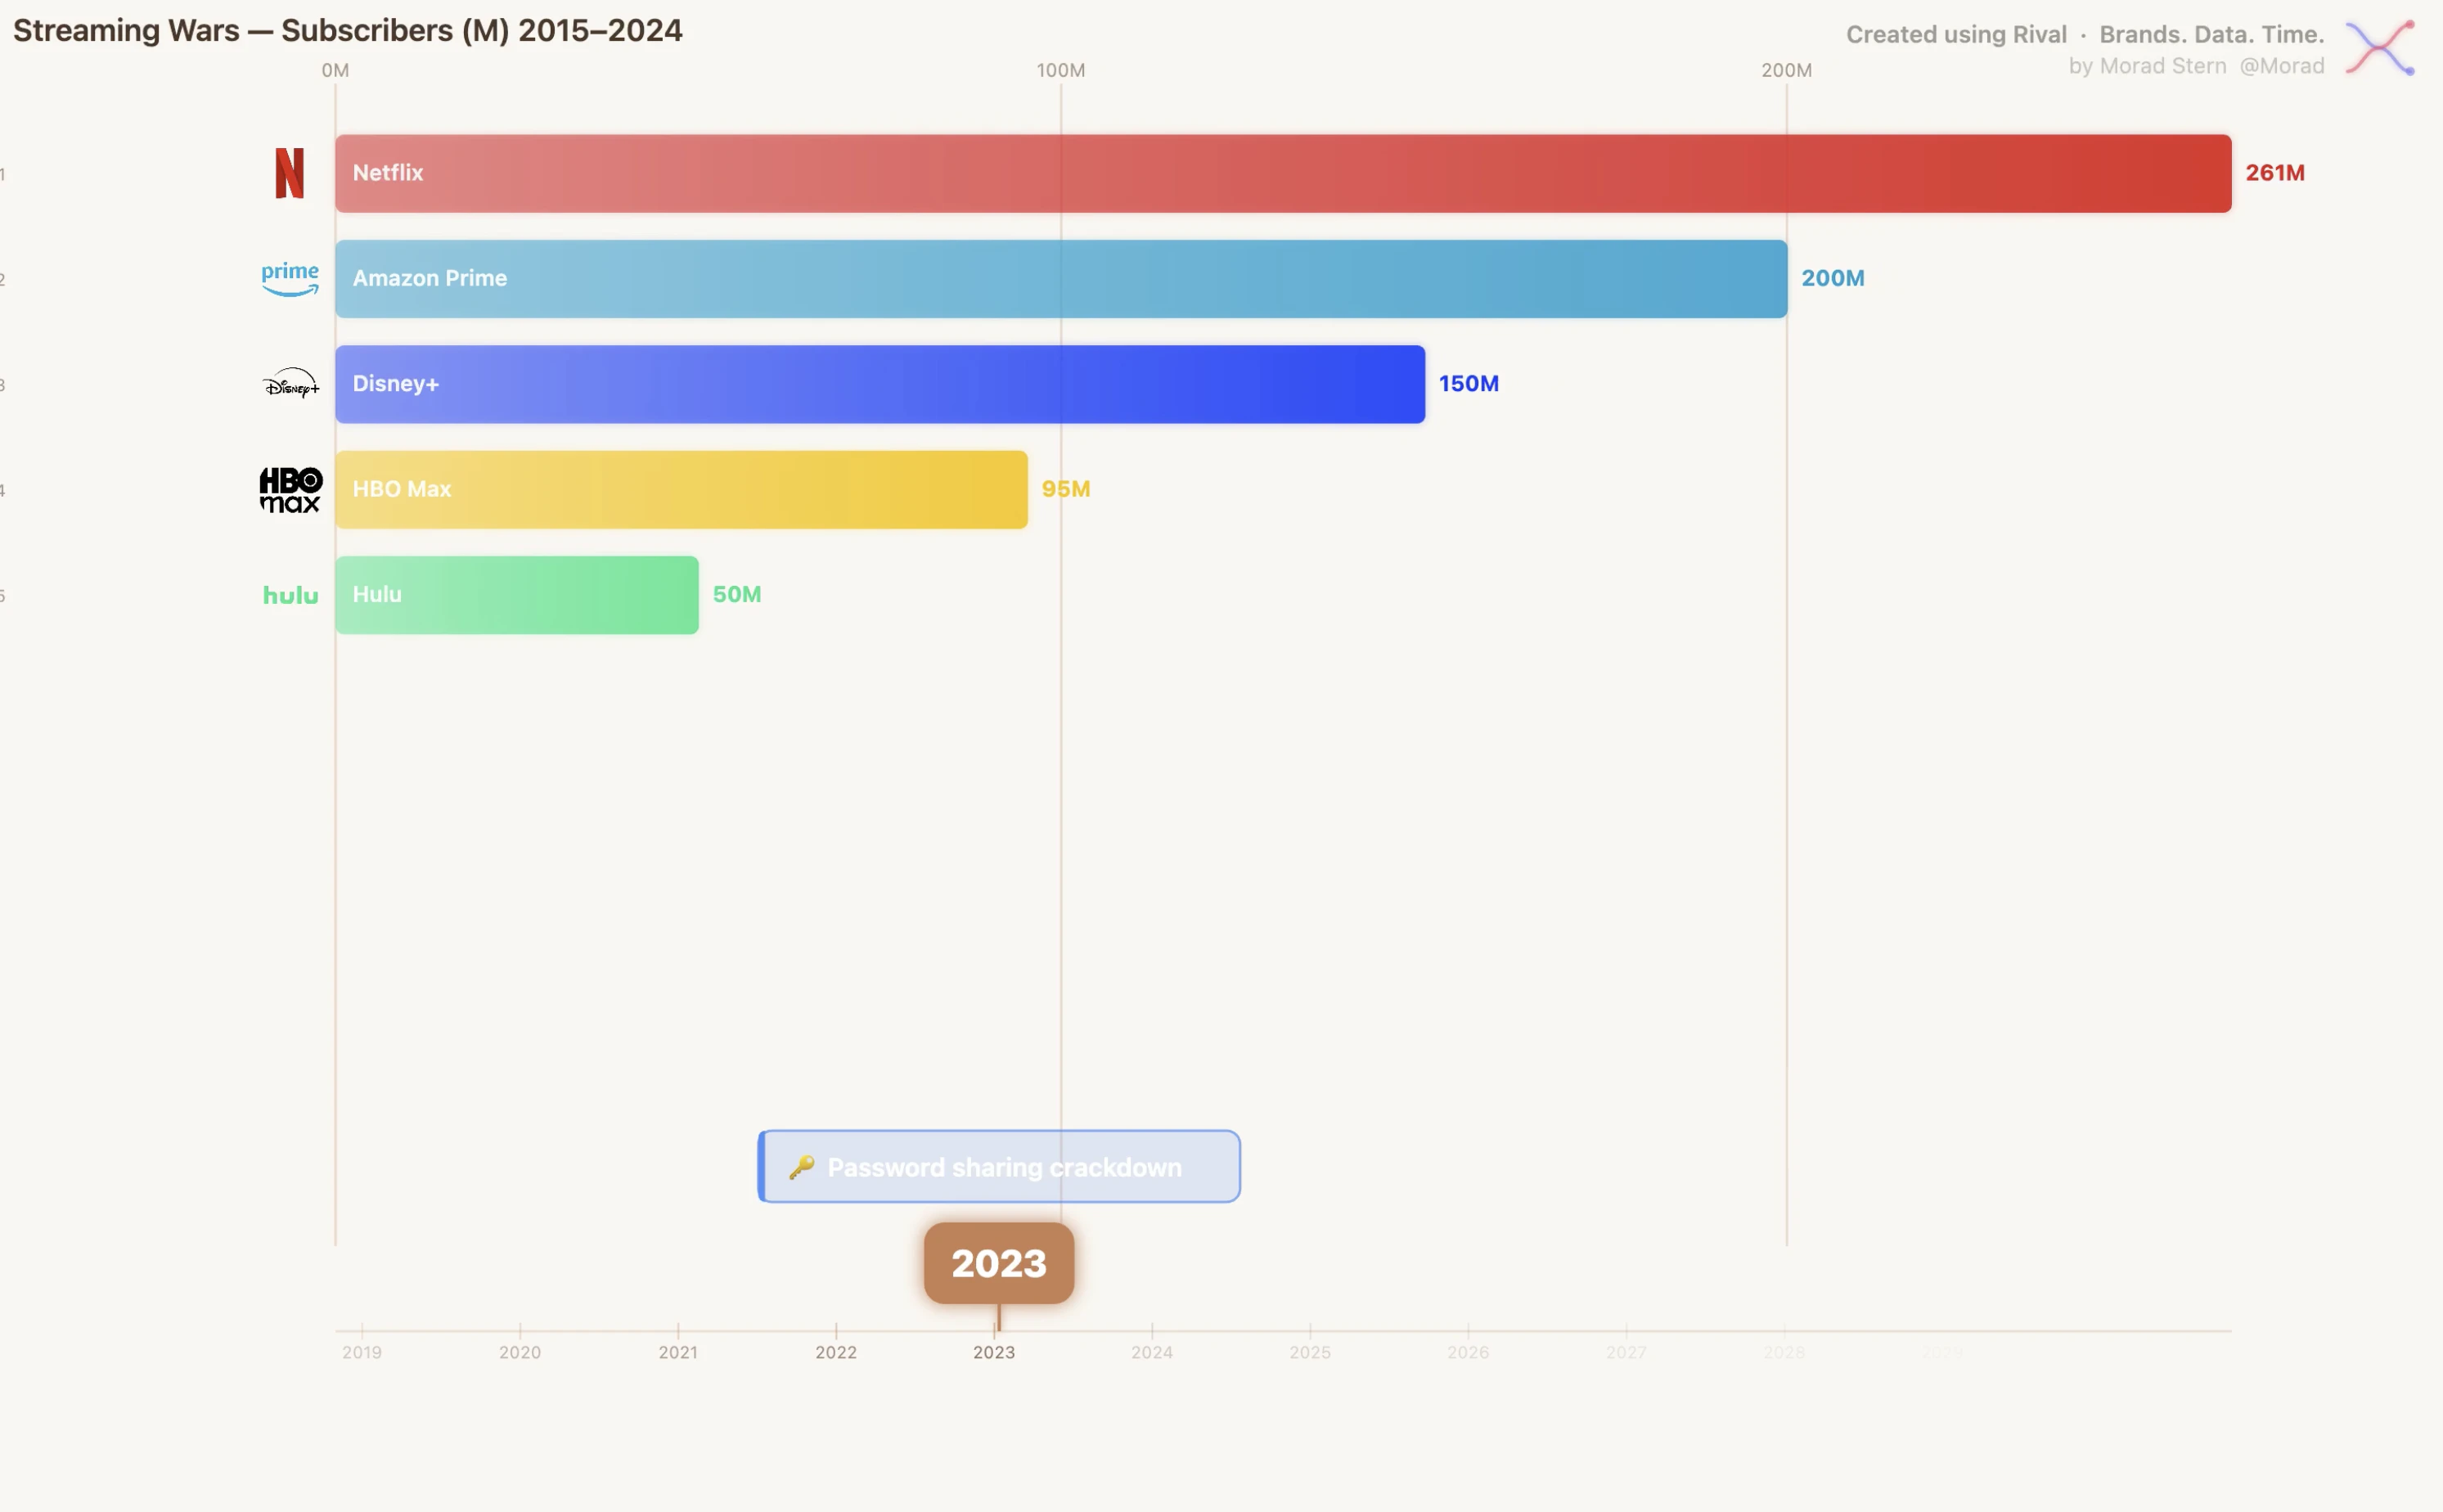
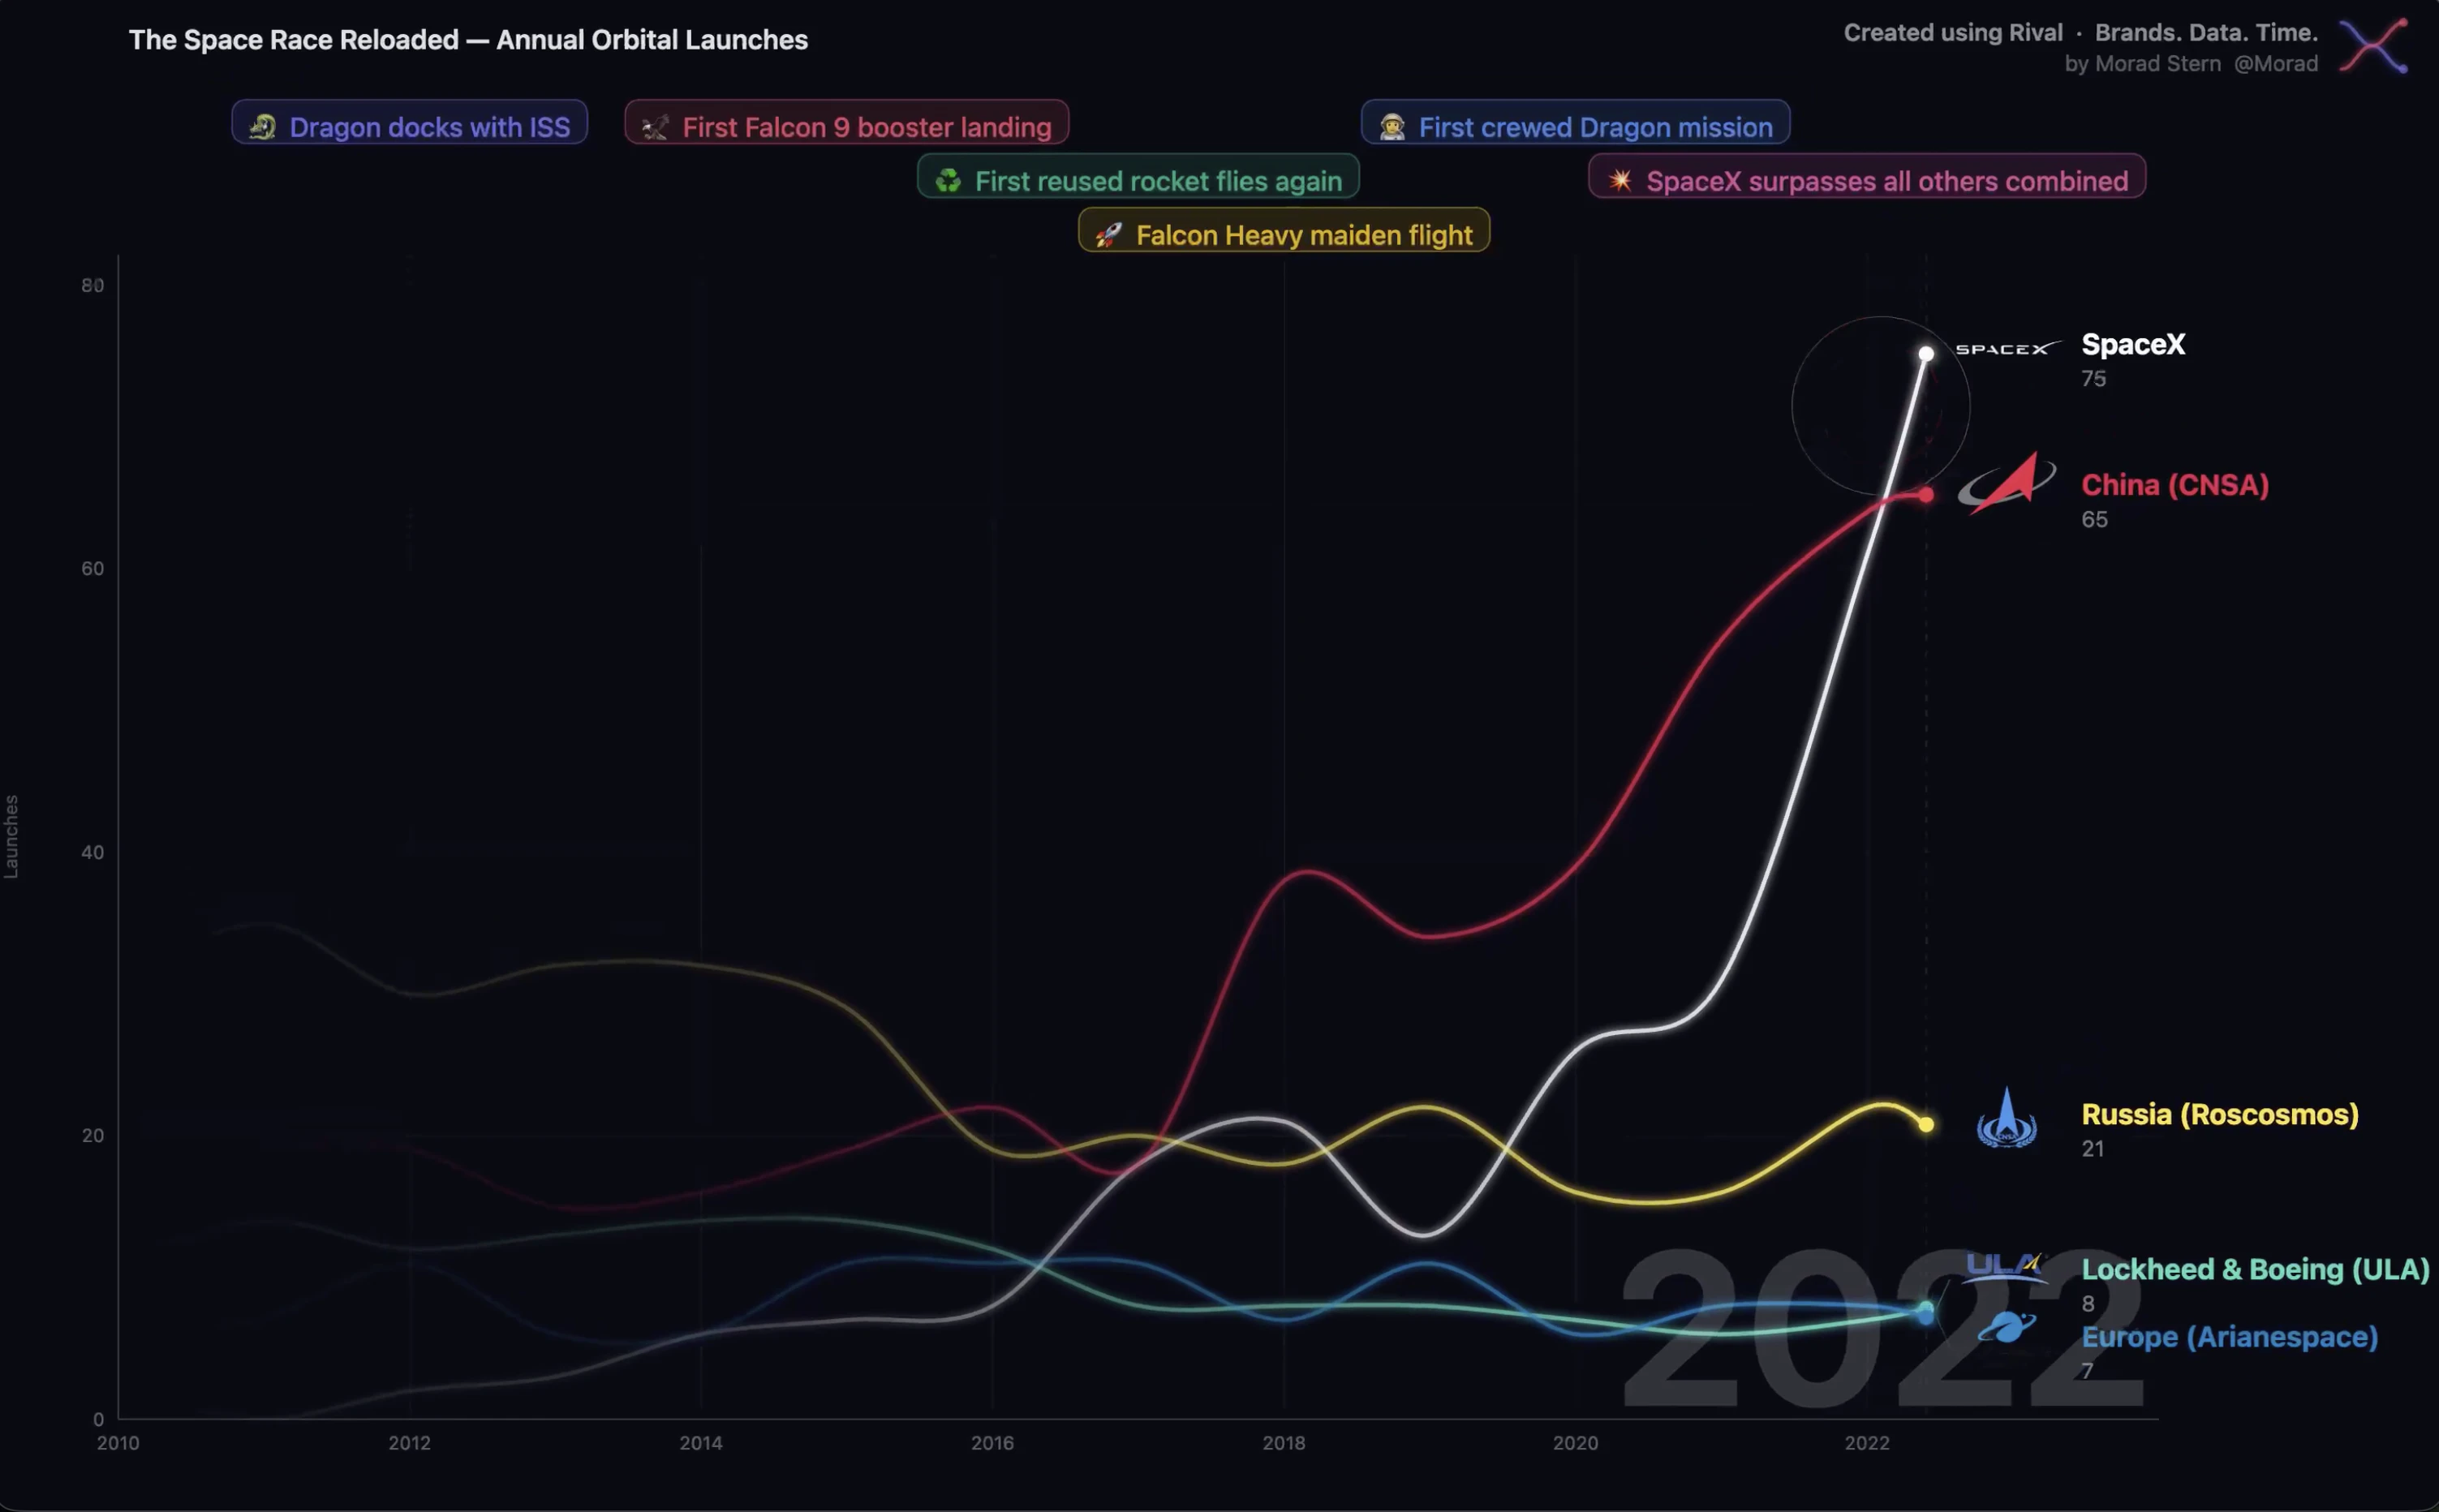
Rival Charts is an innovative no-code platform that empowers users to create captivating interactive bar chart races in seconds. Designed for journalists, content creators, data analysts, and marketers, it transforms static data into engaging visual stories that are more likely to be watched, shared, and remembered. Users simply upload their data, choose a theme, and Rival automatically generates stunning MP4 videos or interactive HTML visualizations, making data storytelling accessible and impactful without technical expertise. Its quick and intuitive process helps turn complex numbers into dynamic content that captures attention and drives engagement, ideal for social media, presentations, and reports. What sets Rival Charts apart is its focus on virality and ease of use, enabling anyone to produce professional-quality animated charts effortlessly.
Screenshots
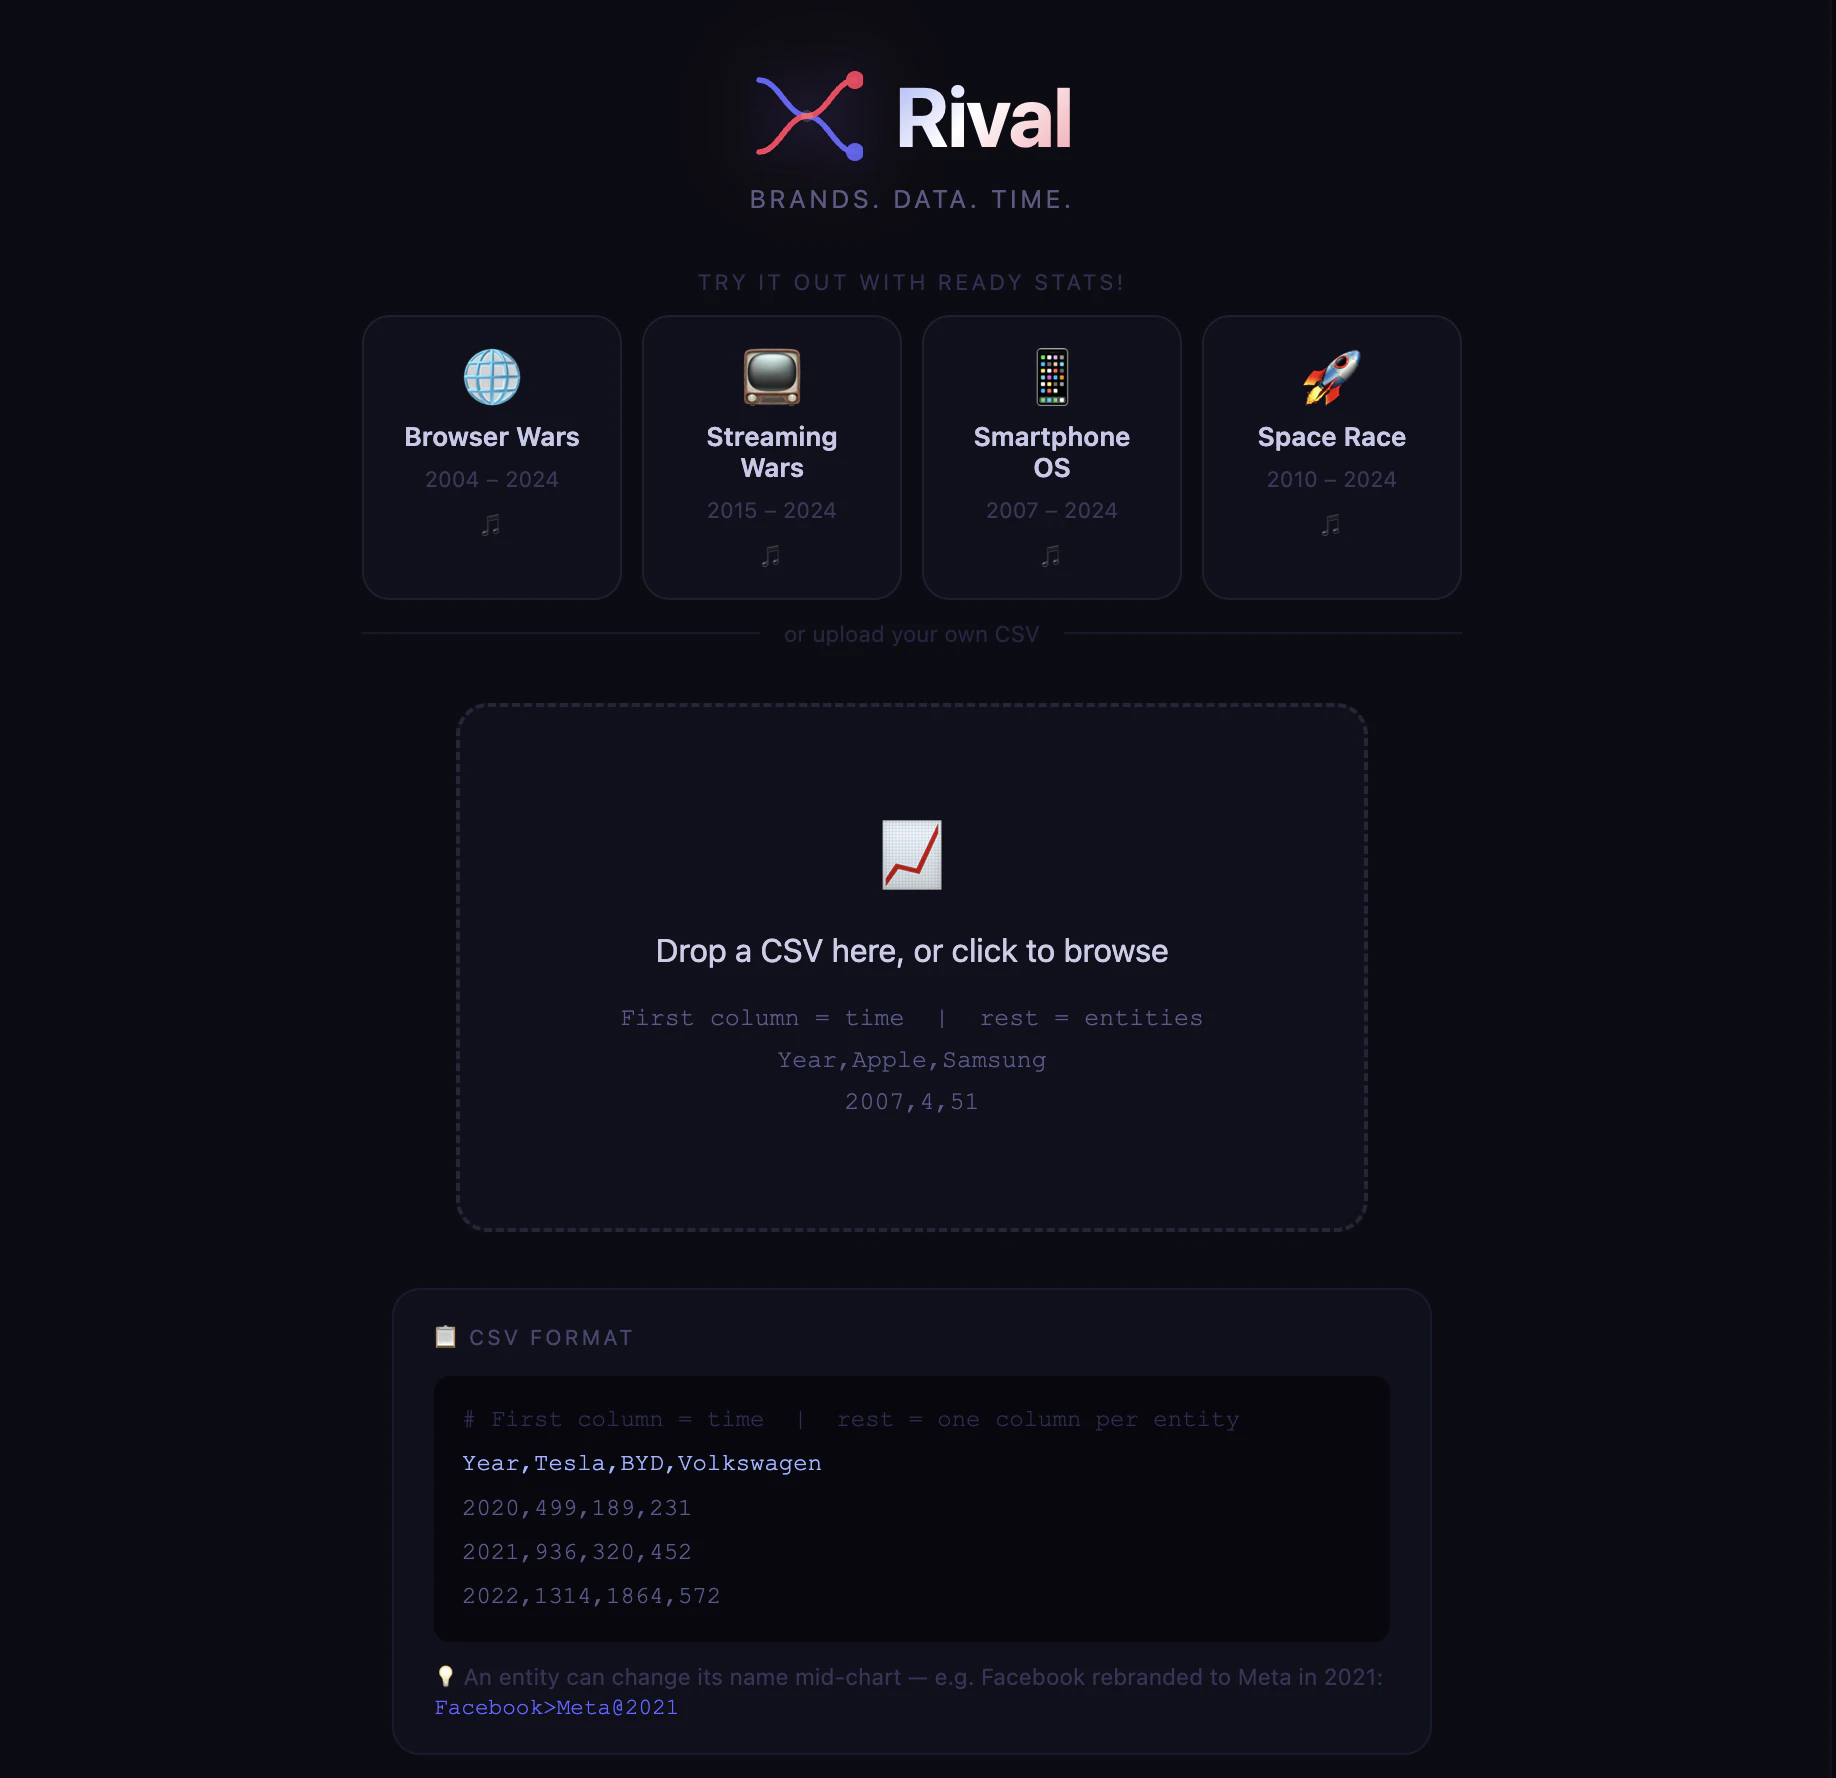
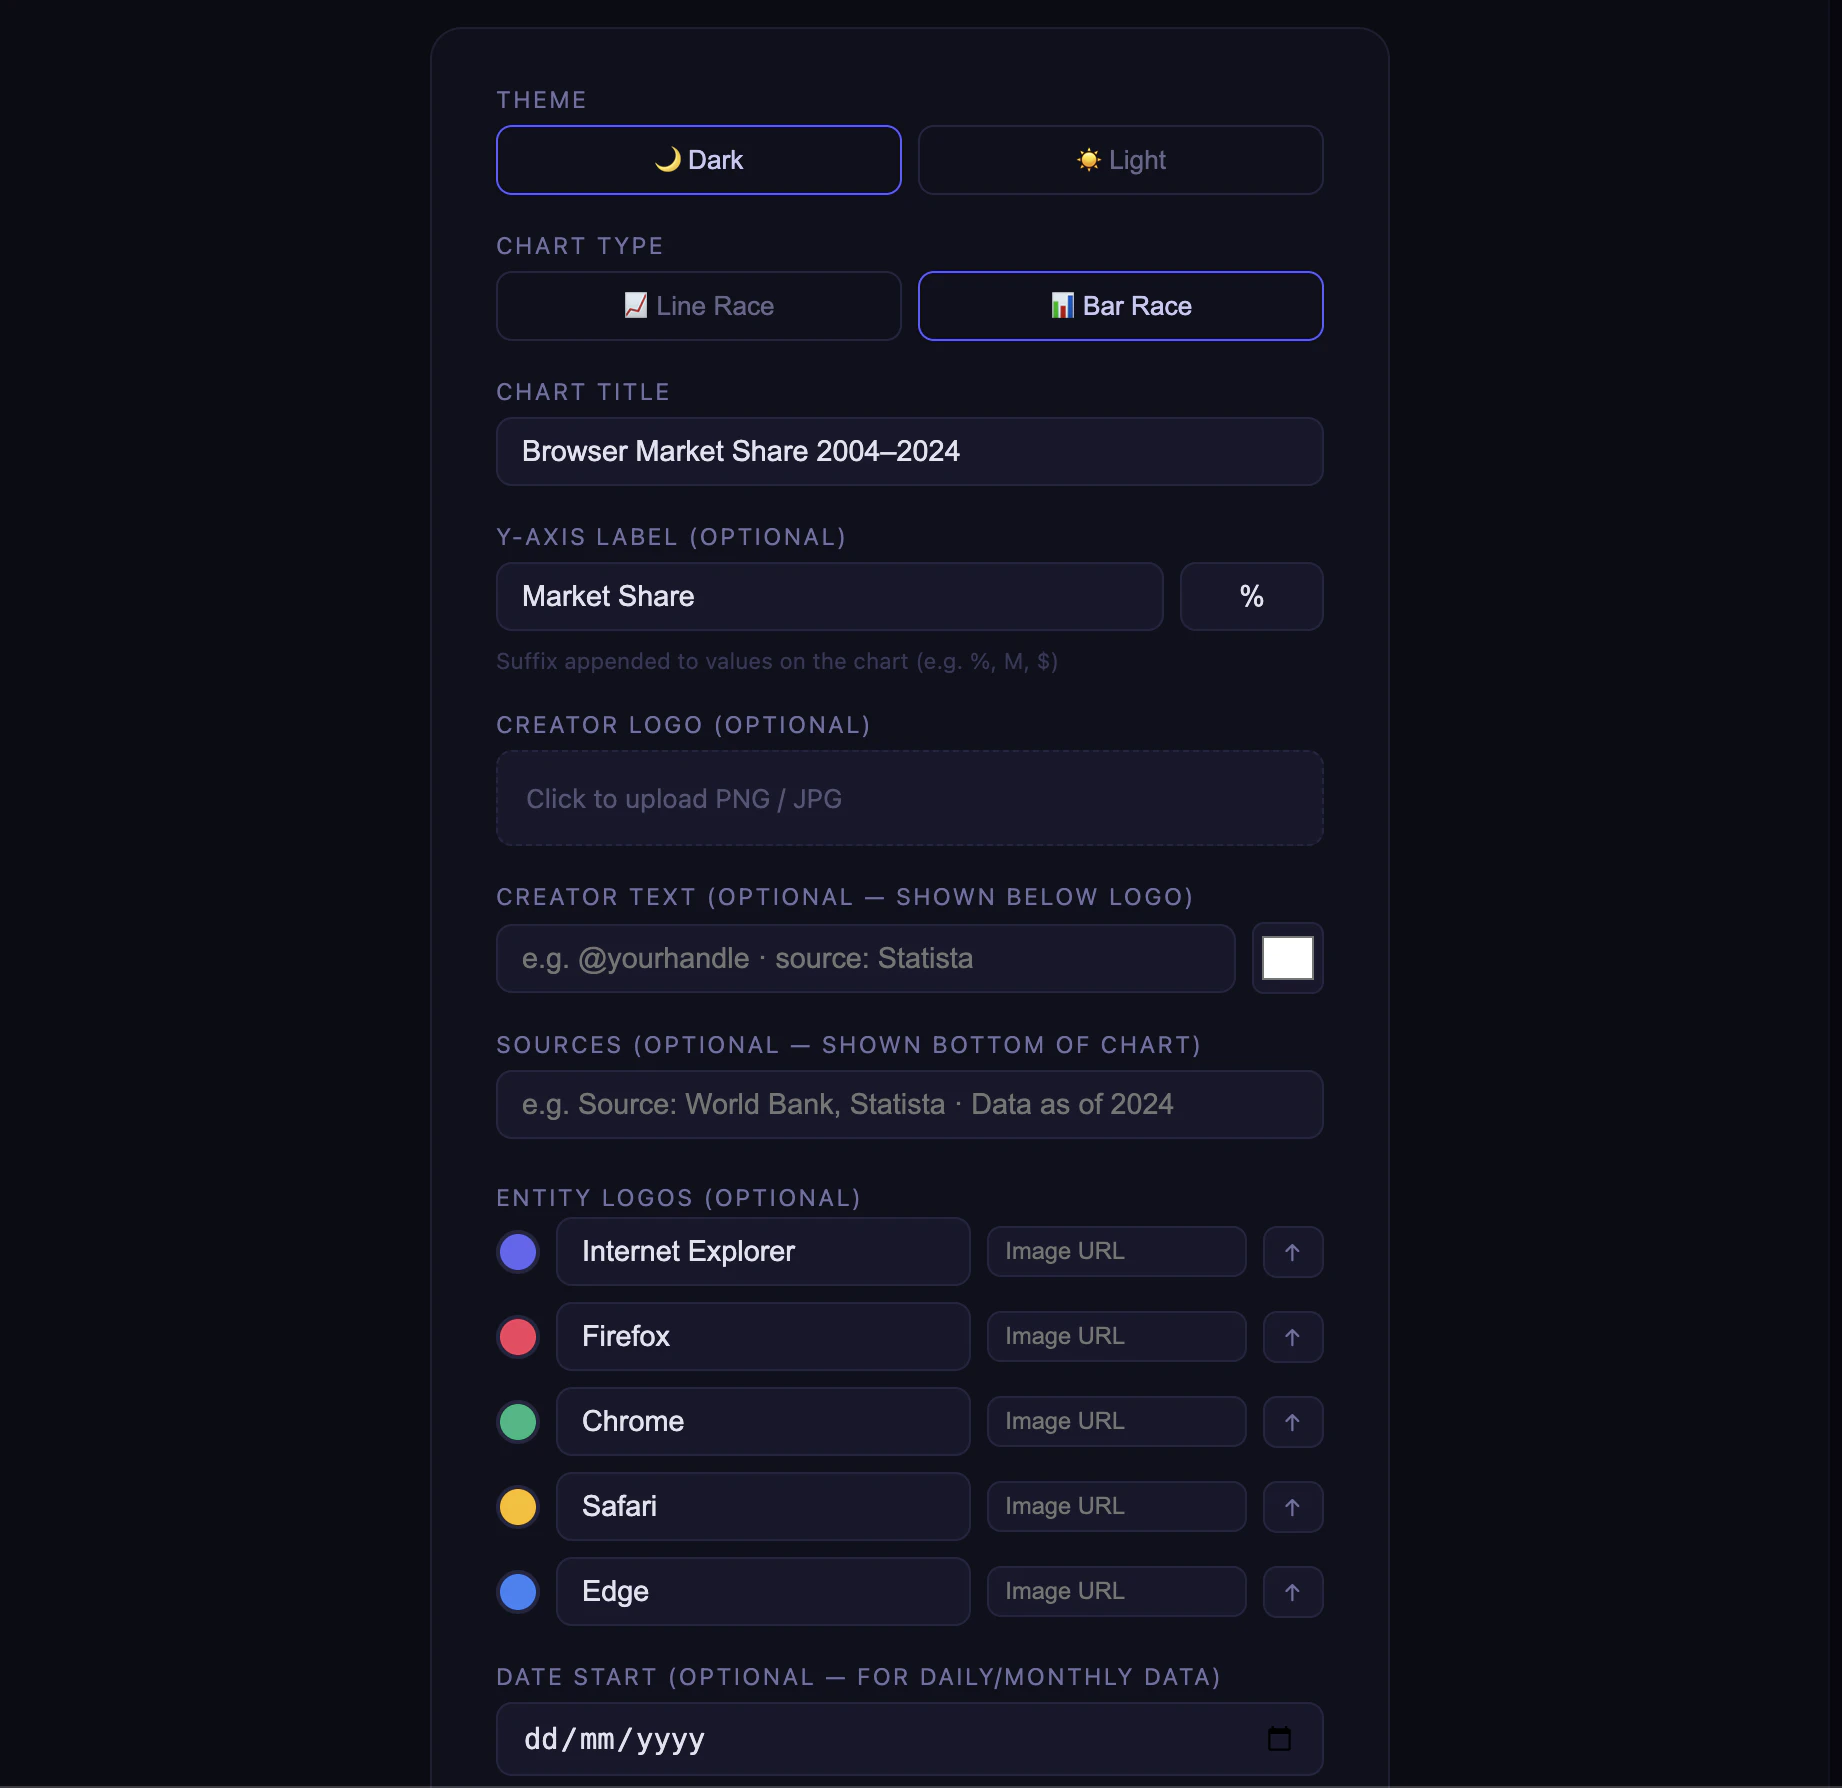
Pros
- ✓User-friendly interface suitable for non-technical users
- ✓Quick transformation of data into engaging videos or interactive visuals
- ✓Supports both MP4 videos and HTML interactive experiences
- ✓Ideal for social media content, presentations, and reports
- ✓No coding skills required
Cons
- ✗Limited customization options compared to advanced data visualization tools
- ✗May have constraints on data size or complexity for large datasets
- ✗Pricing details are not explicitly provided, which could impact budget planning
Use Cases
Pricing
Likely follows a freemium model with free access for basic features and paid plans for advanced options, higher resolution videos, or commercial use. Exact pricing details are not specified, so potential users may need to inquire directly or explore the platform for detailed plans.
Quick Info
Topics
Alternatives
Similar Tools in AI Image & Design




Embed Badge
Add this badge to your website to show that Rival Charts is featured on Visalytica.
<a href="https://www.visalytica.com/tool/rival-charts" target="_blank" rel="noopener noreferrer" style="display:inline-flex;align-items:center;gap:6px;padding:6px 14px;background:#7c3aed;color:#fff;border-radius:8px;font-family:-apple-system,system-ui,sans-serif;font-size:13px;font-weight:600;text-decoration:none;transition:background .2s" onmouseover="this.style.background='#6d28d9'" onmouseout="this.style.background='#7c3aed'"><svg width="14" height="14" viewBox="0 0 24 24" fill="none" stroke="currentColor" stroke-width="2.5" stroke-linecap="round" stroke-linejoin="round"><path d="M12 20V10"/><path d="M18 20V4"/><path d="M6 20v-4"/></svg>Featured on Visalytica</a>