
RankGlide
Create animated ranking charts and embed them anywhere
About RankGlide
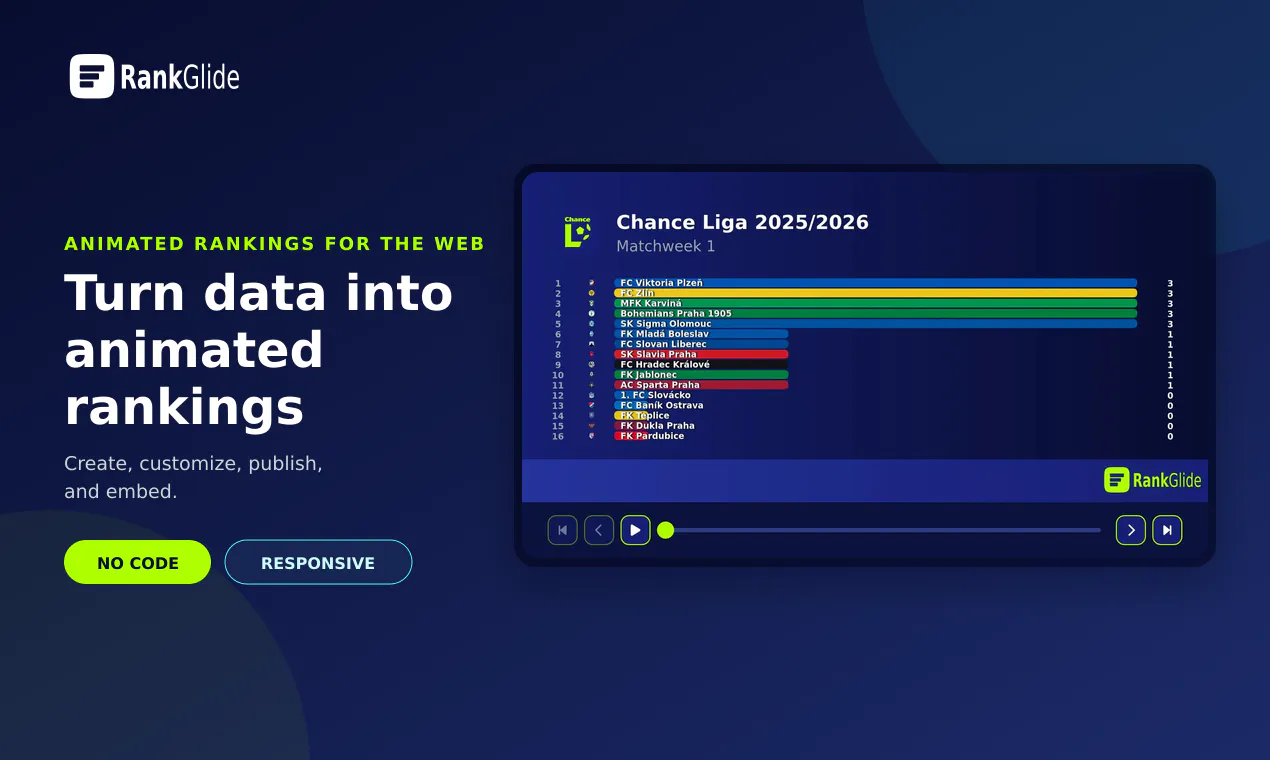

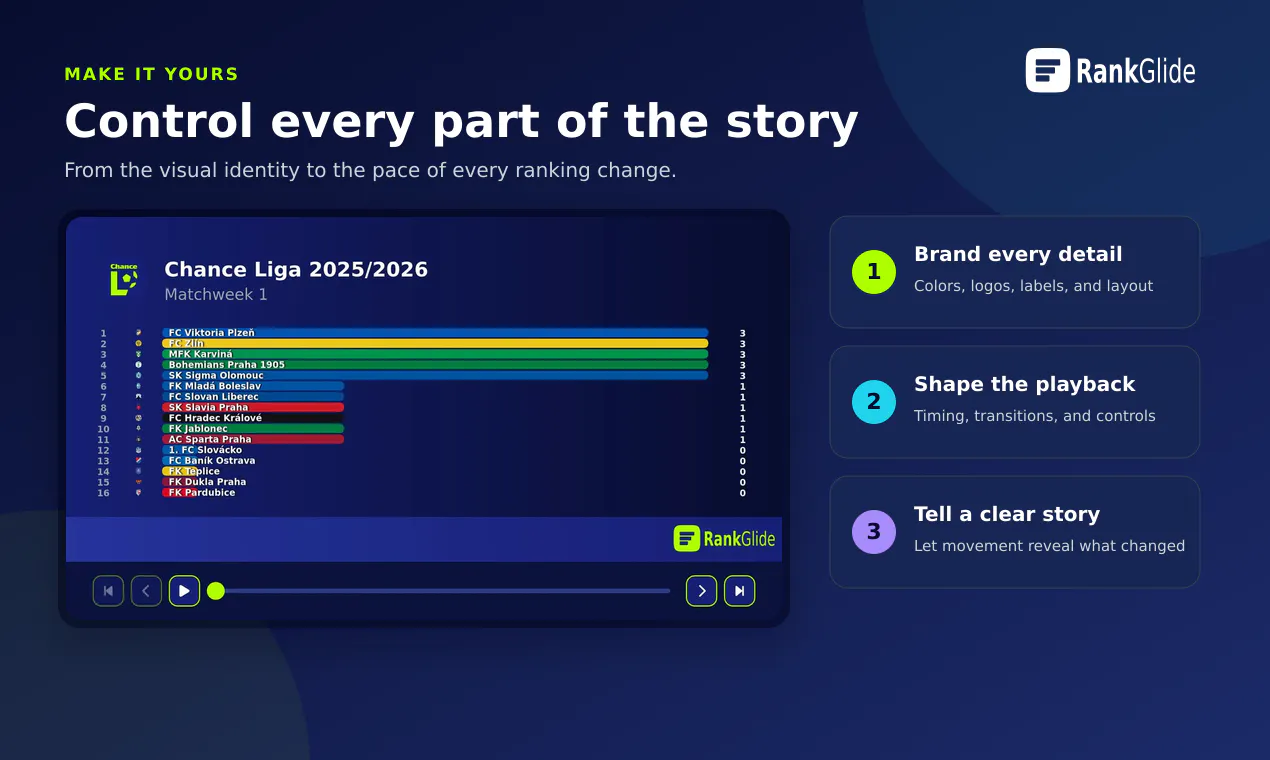
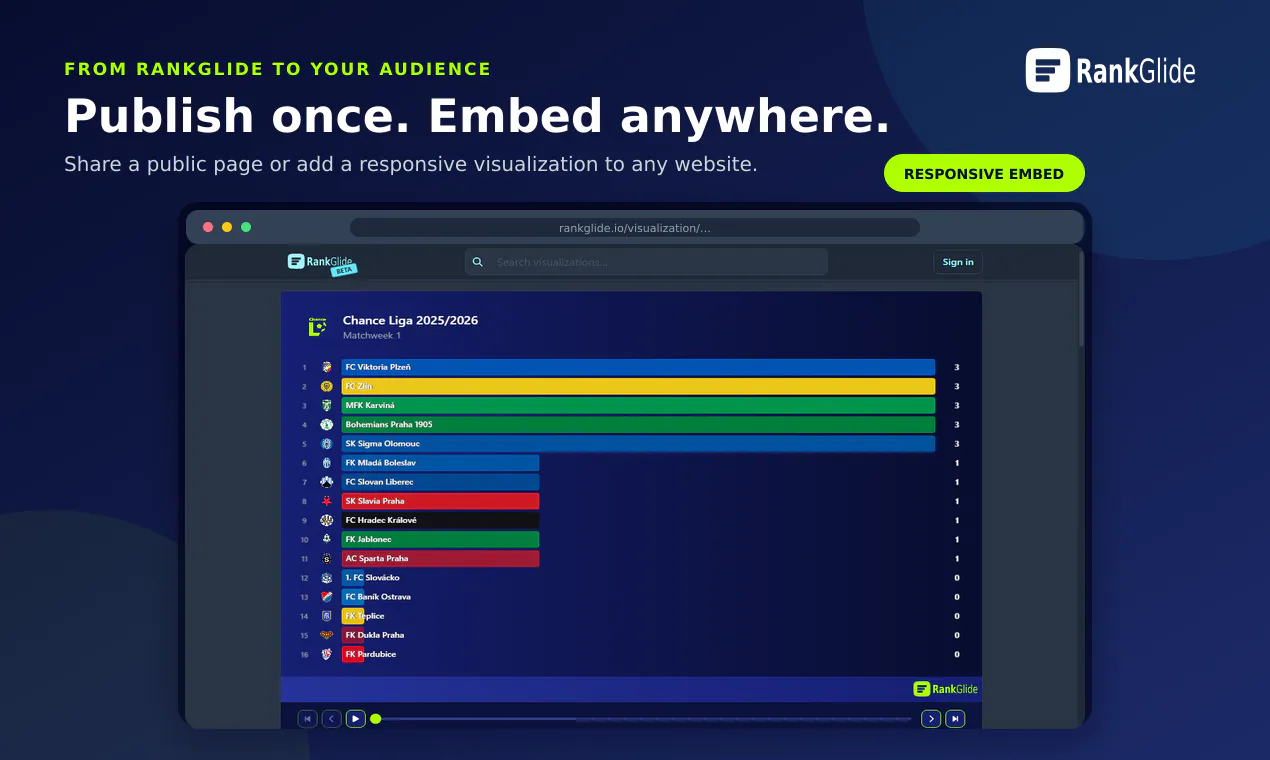
RankGlide is a no-code tool designed for creating visually appealing, animated ranking charts from time-series data. It caters to data analysts, marketers, educators, and content creators who want to present dynamic rankings in a polished manner without needing programming skills. Its core strength lies in enabling users to generate customizable, animated visualizations that can be embedded seamlessly into websites, reports, or presentations. With features like playback control and design customization, RankGlide makes it easy to communicate complex data trends in an engaging way. Its collaborative capabilities further enhance team workflows, allowing multiple users to work together on visualizations before publishing. Overall, RankGlide stands out by combining ease of use with professional-quality animations, making data storytelling accessible to a broader audience.
Screenshots
Pros
- ✓No coding required, user-friendly interface
- ✓Highly customizable animations and visual styles
- ✓Easy embedding of responsive charts into websites and presentations
- ✓Supports team collaboration for streamlined workflows
- ✓Creates polished, professional ranking visualizations
Cons
- ✗Limited information on advanced analytics features
- ✗No details on pricing or free tier availability
- ✗Potential learning curve for complex customizations
Use Cases
Pricing
Pricing not verified
Quick Info
Topics
Makers

Dominik Hladík
Similar Tools in AI Image & Design



Embed Badge
Add this badge to your website to show that RankGlide is featured on Visalytica.
<a href="https://www.visalytica.com/tool/rankglide" target="_blank" rel="noopener noreferrer" style="display:inline-flex;align-items:center;gap:6px;padding:6px 14px;background:#7c3aed;color:#fff;border-radius:8px;font-family:-apple-system,system-ui,sans-serif;font-size:13px;font-weight:600;text-decoration:none;transition:background .2s" onmouseover="this.style.background='#6d28d9'" onmouseout="this.style.background='#7c3aed'"><svg width="14" height="14" viewBox="0 0 24 24" fill="none" stroke="currentColor" stroke-width="2.5" stroke-linecap="round" stroke-linejoin="round"><path d="M12 20V10"/><path d="M18 20V4"/><path d="M6 20v-4"/></svg>Featured on Visalytica</a>