
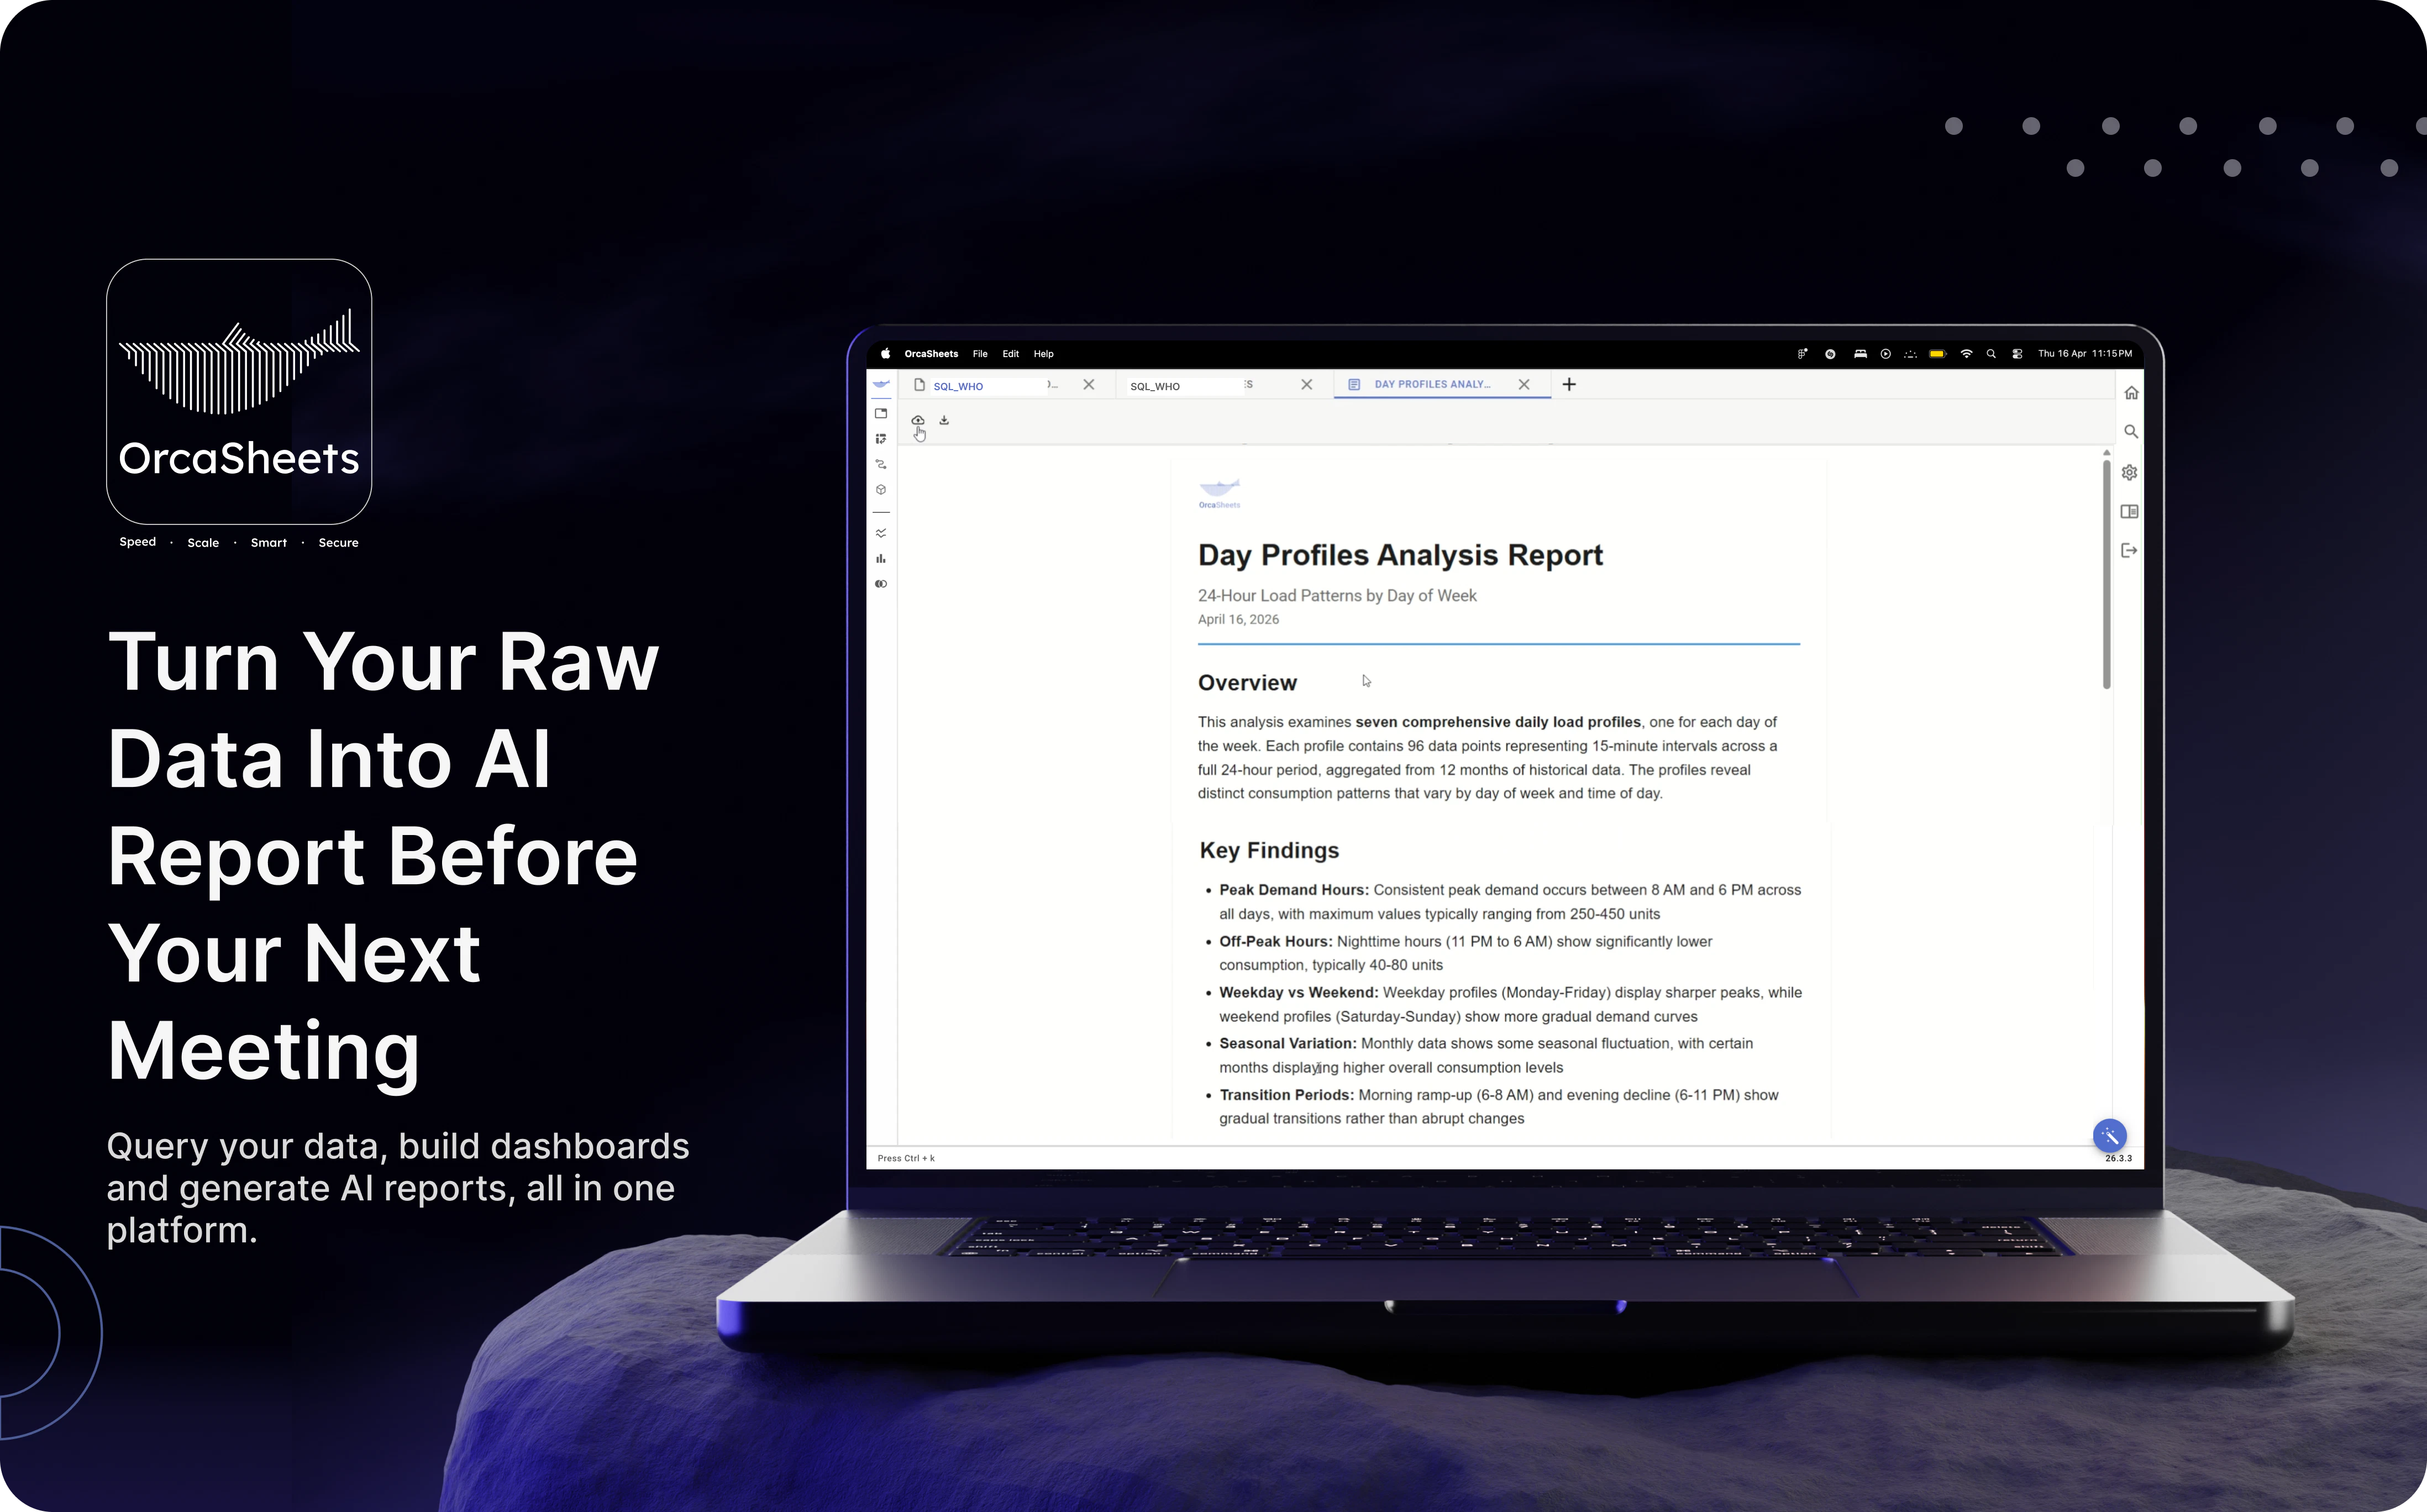
OrcaSheets AI Reports
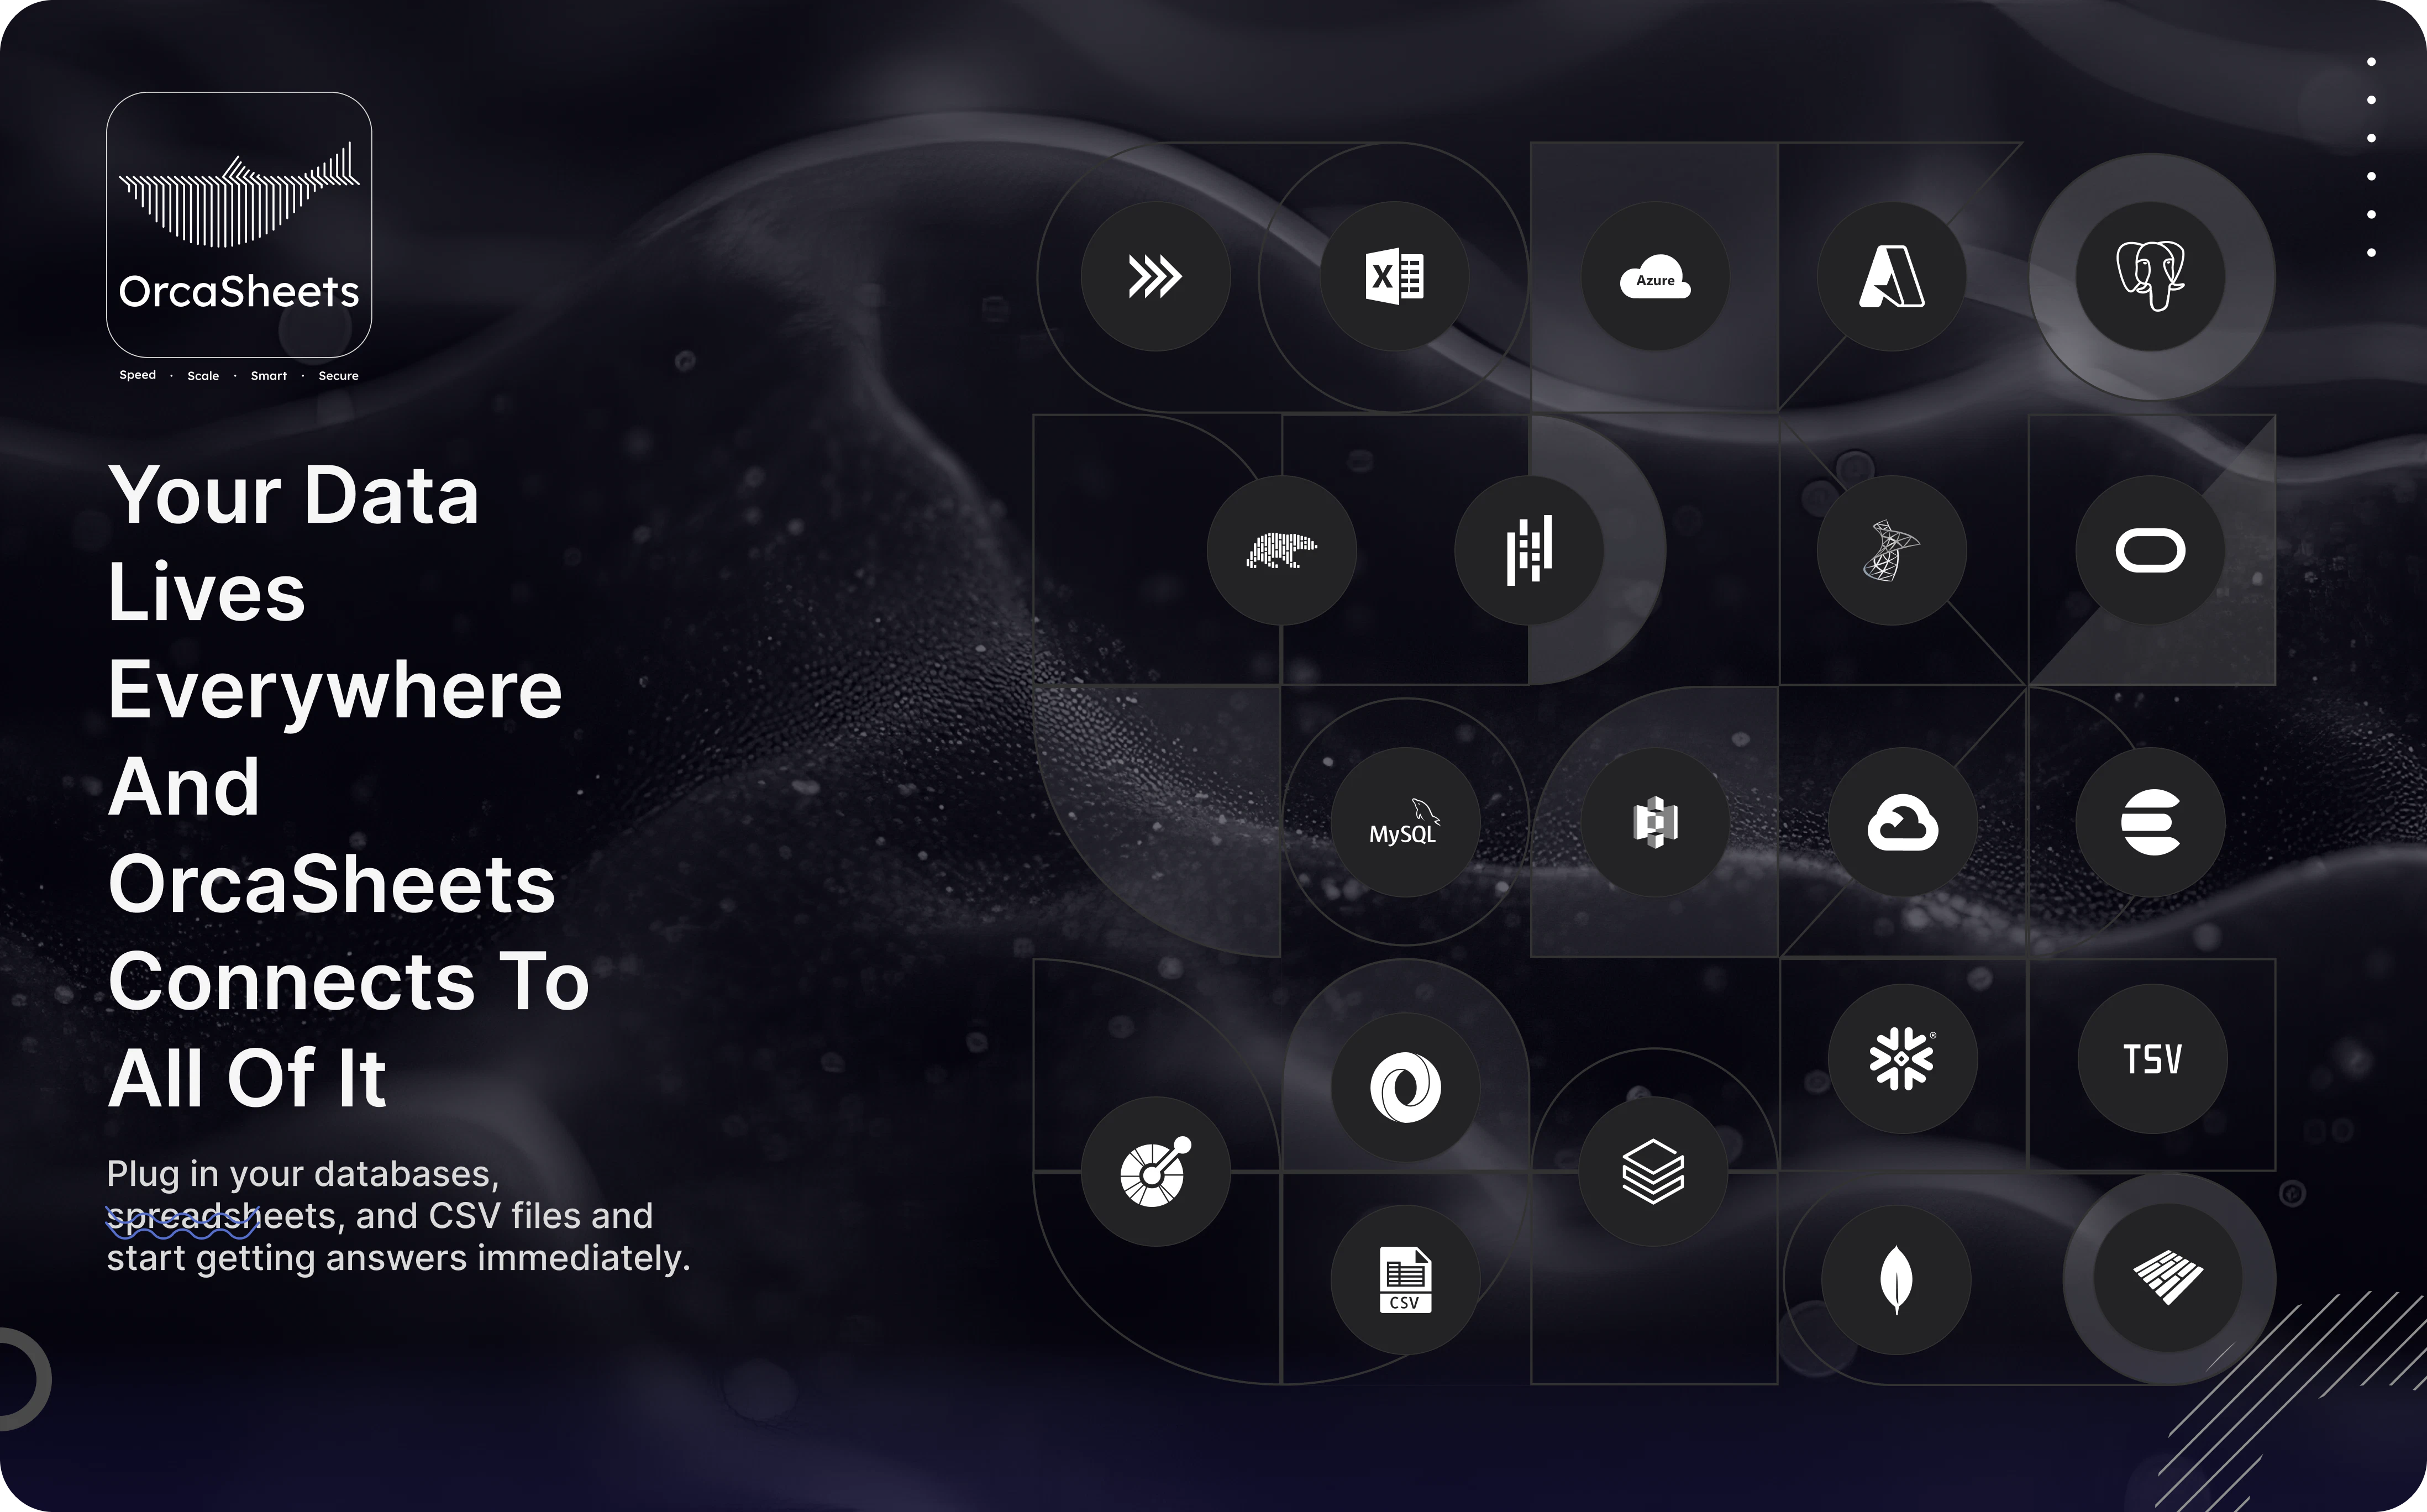
Query data to build dashboards and generate detailed reports
About OrcaSheets AI Reports
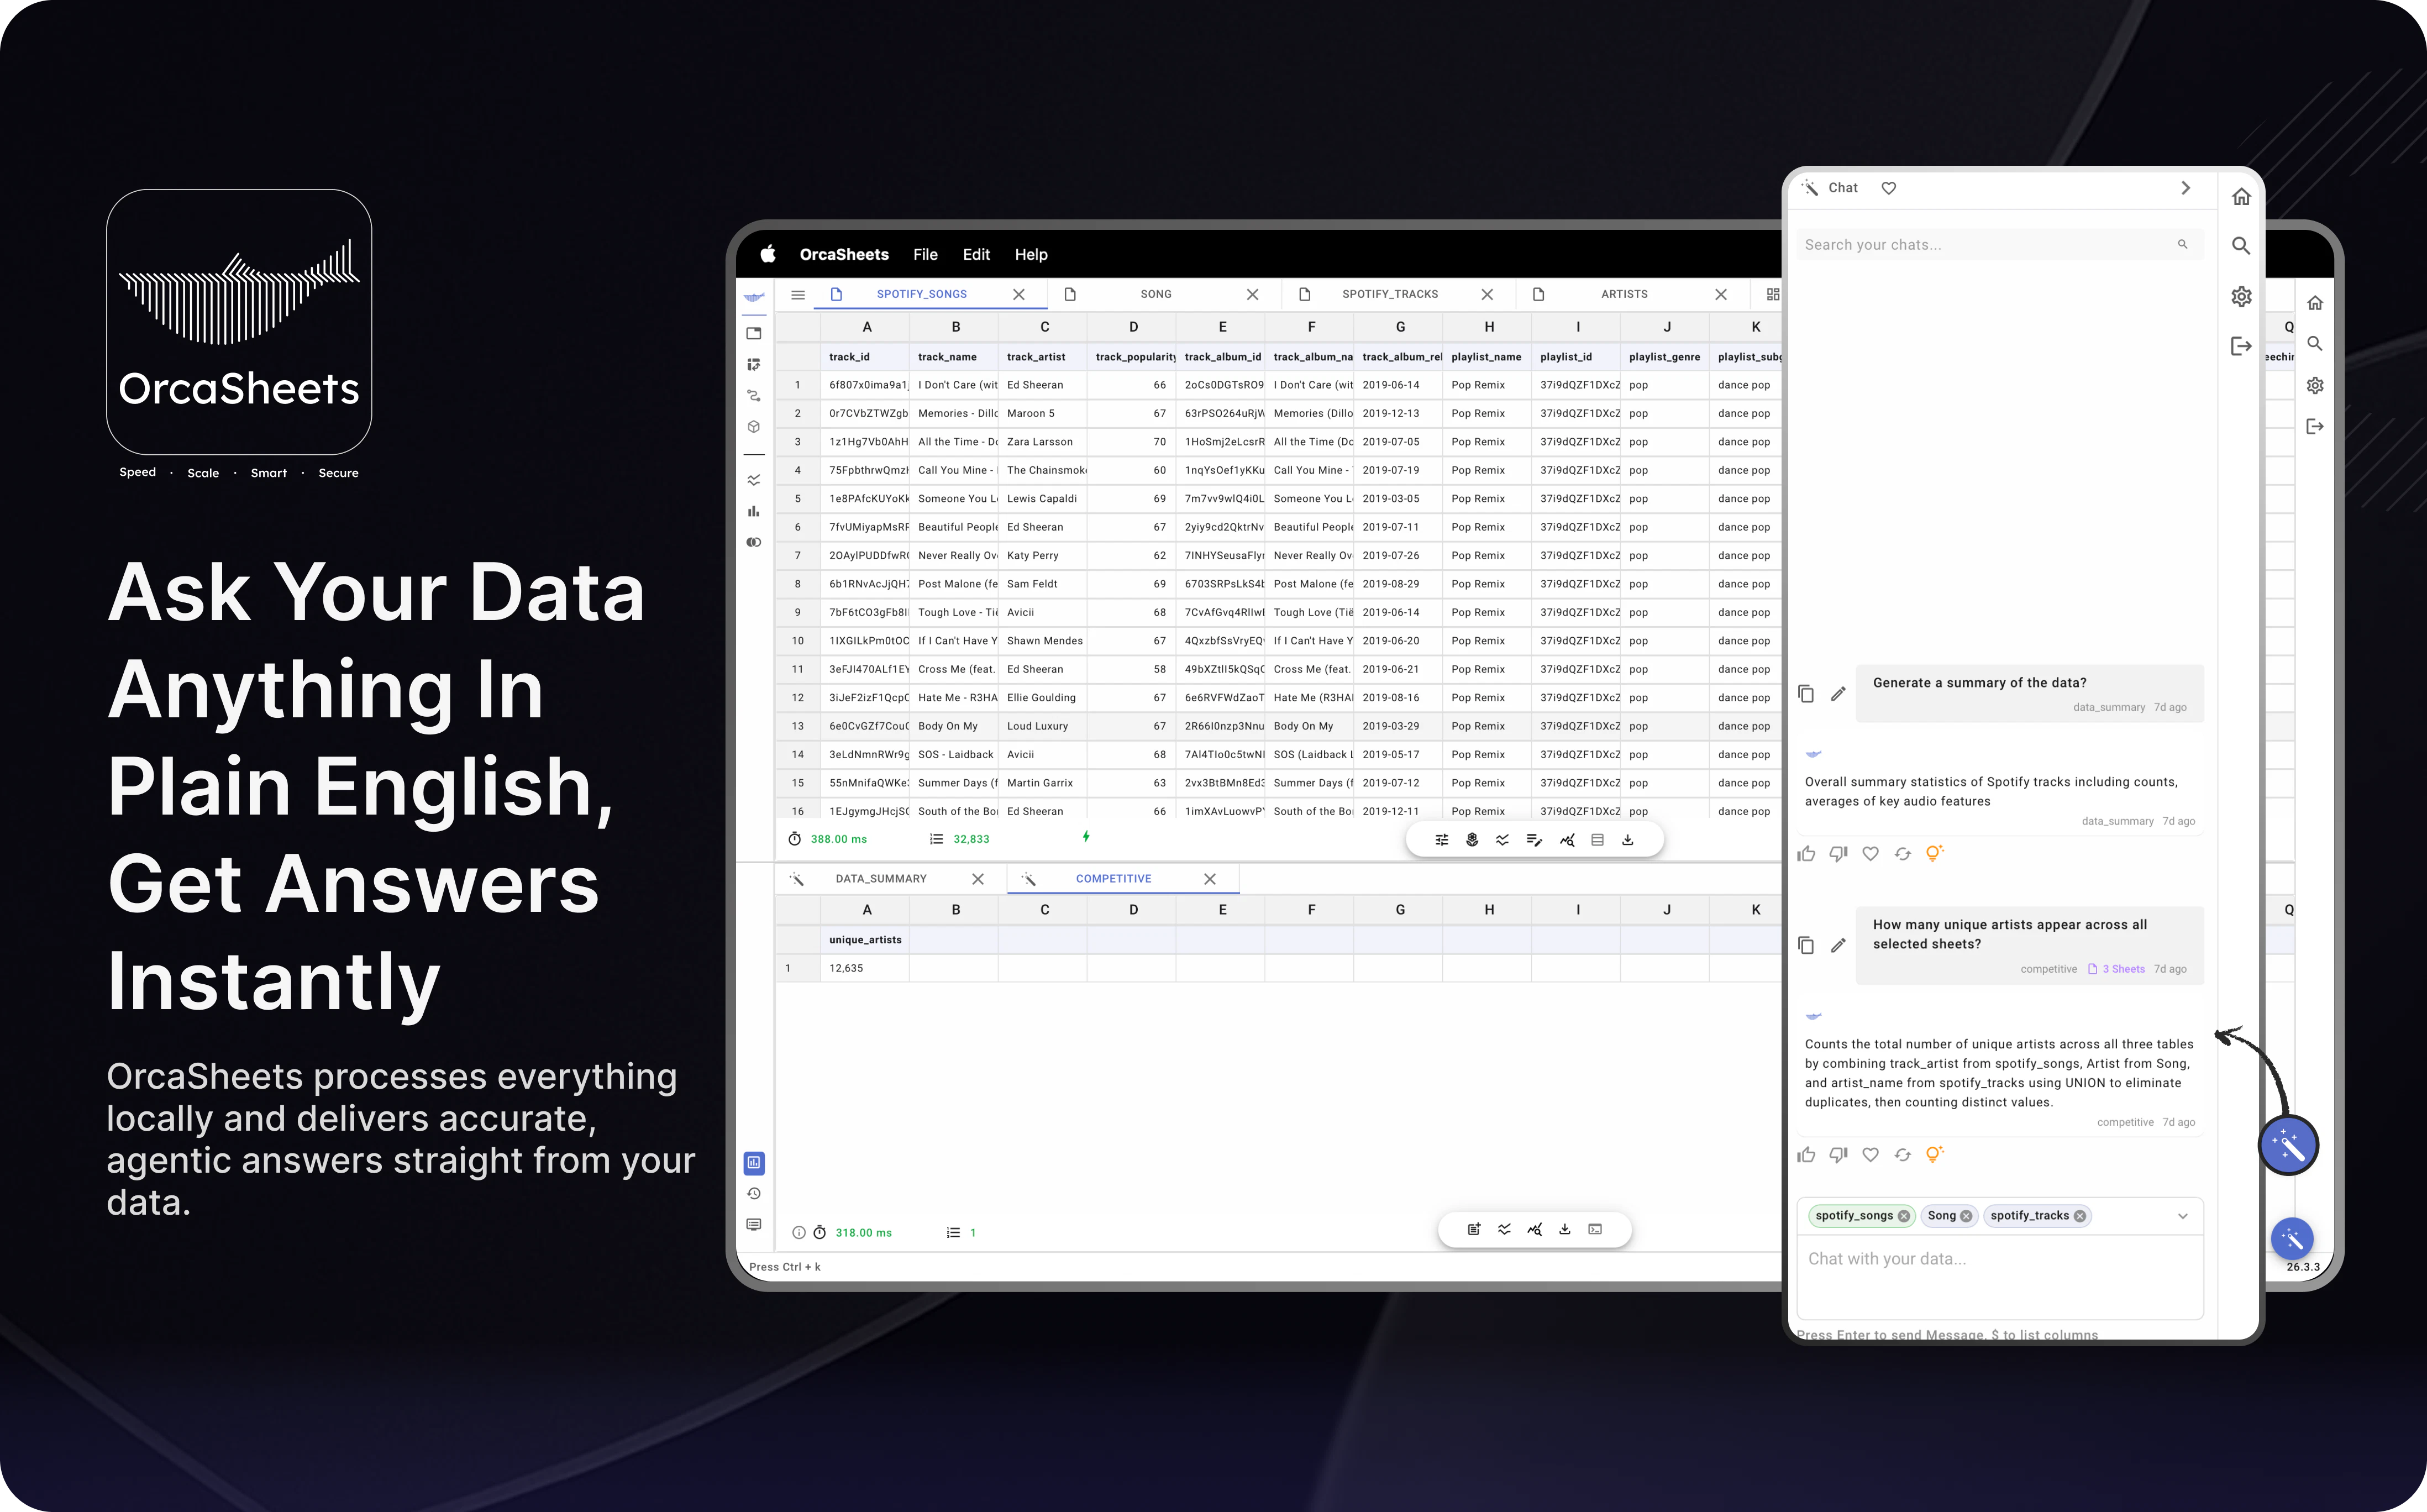
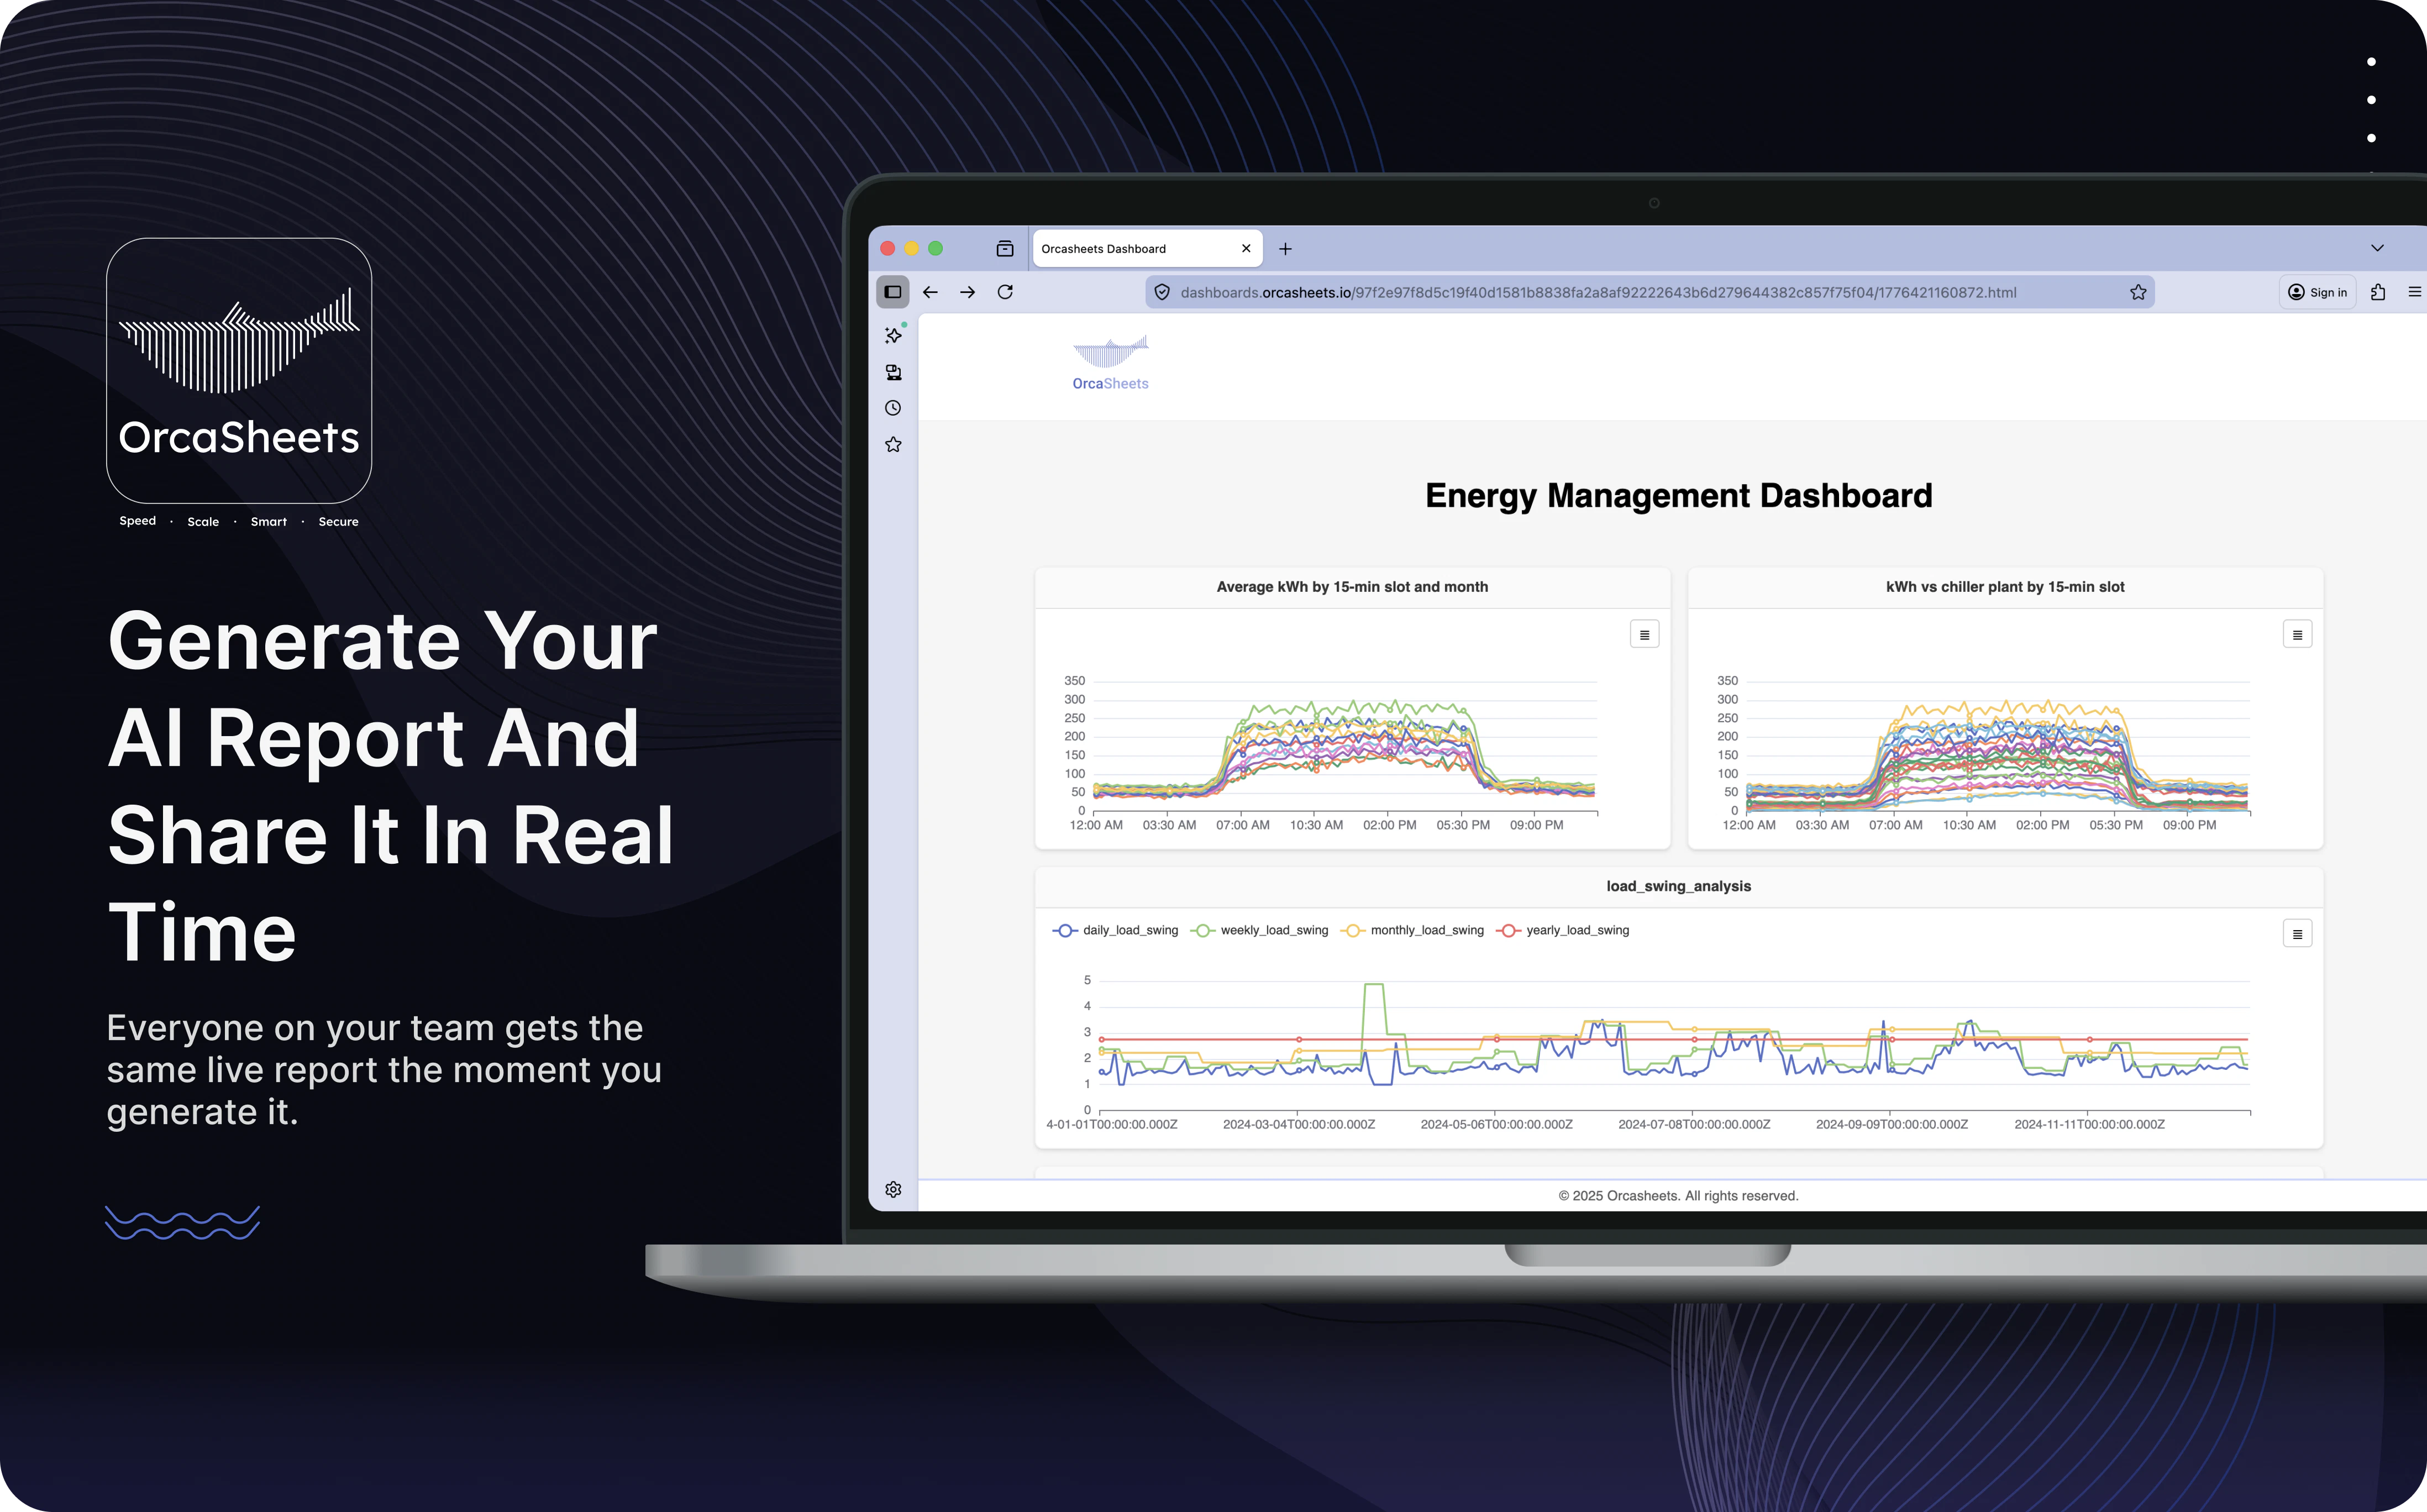
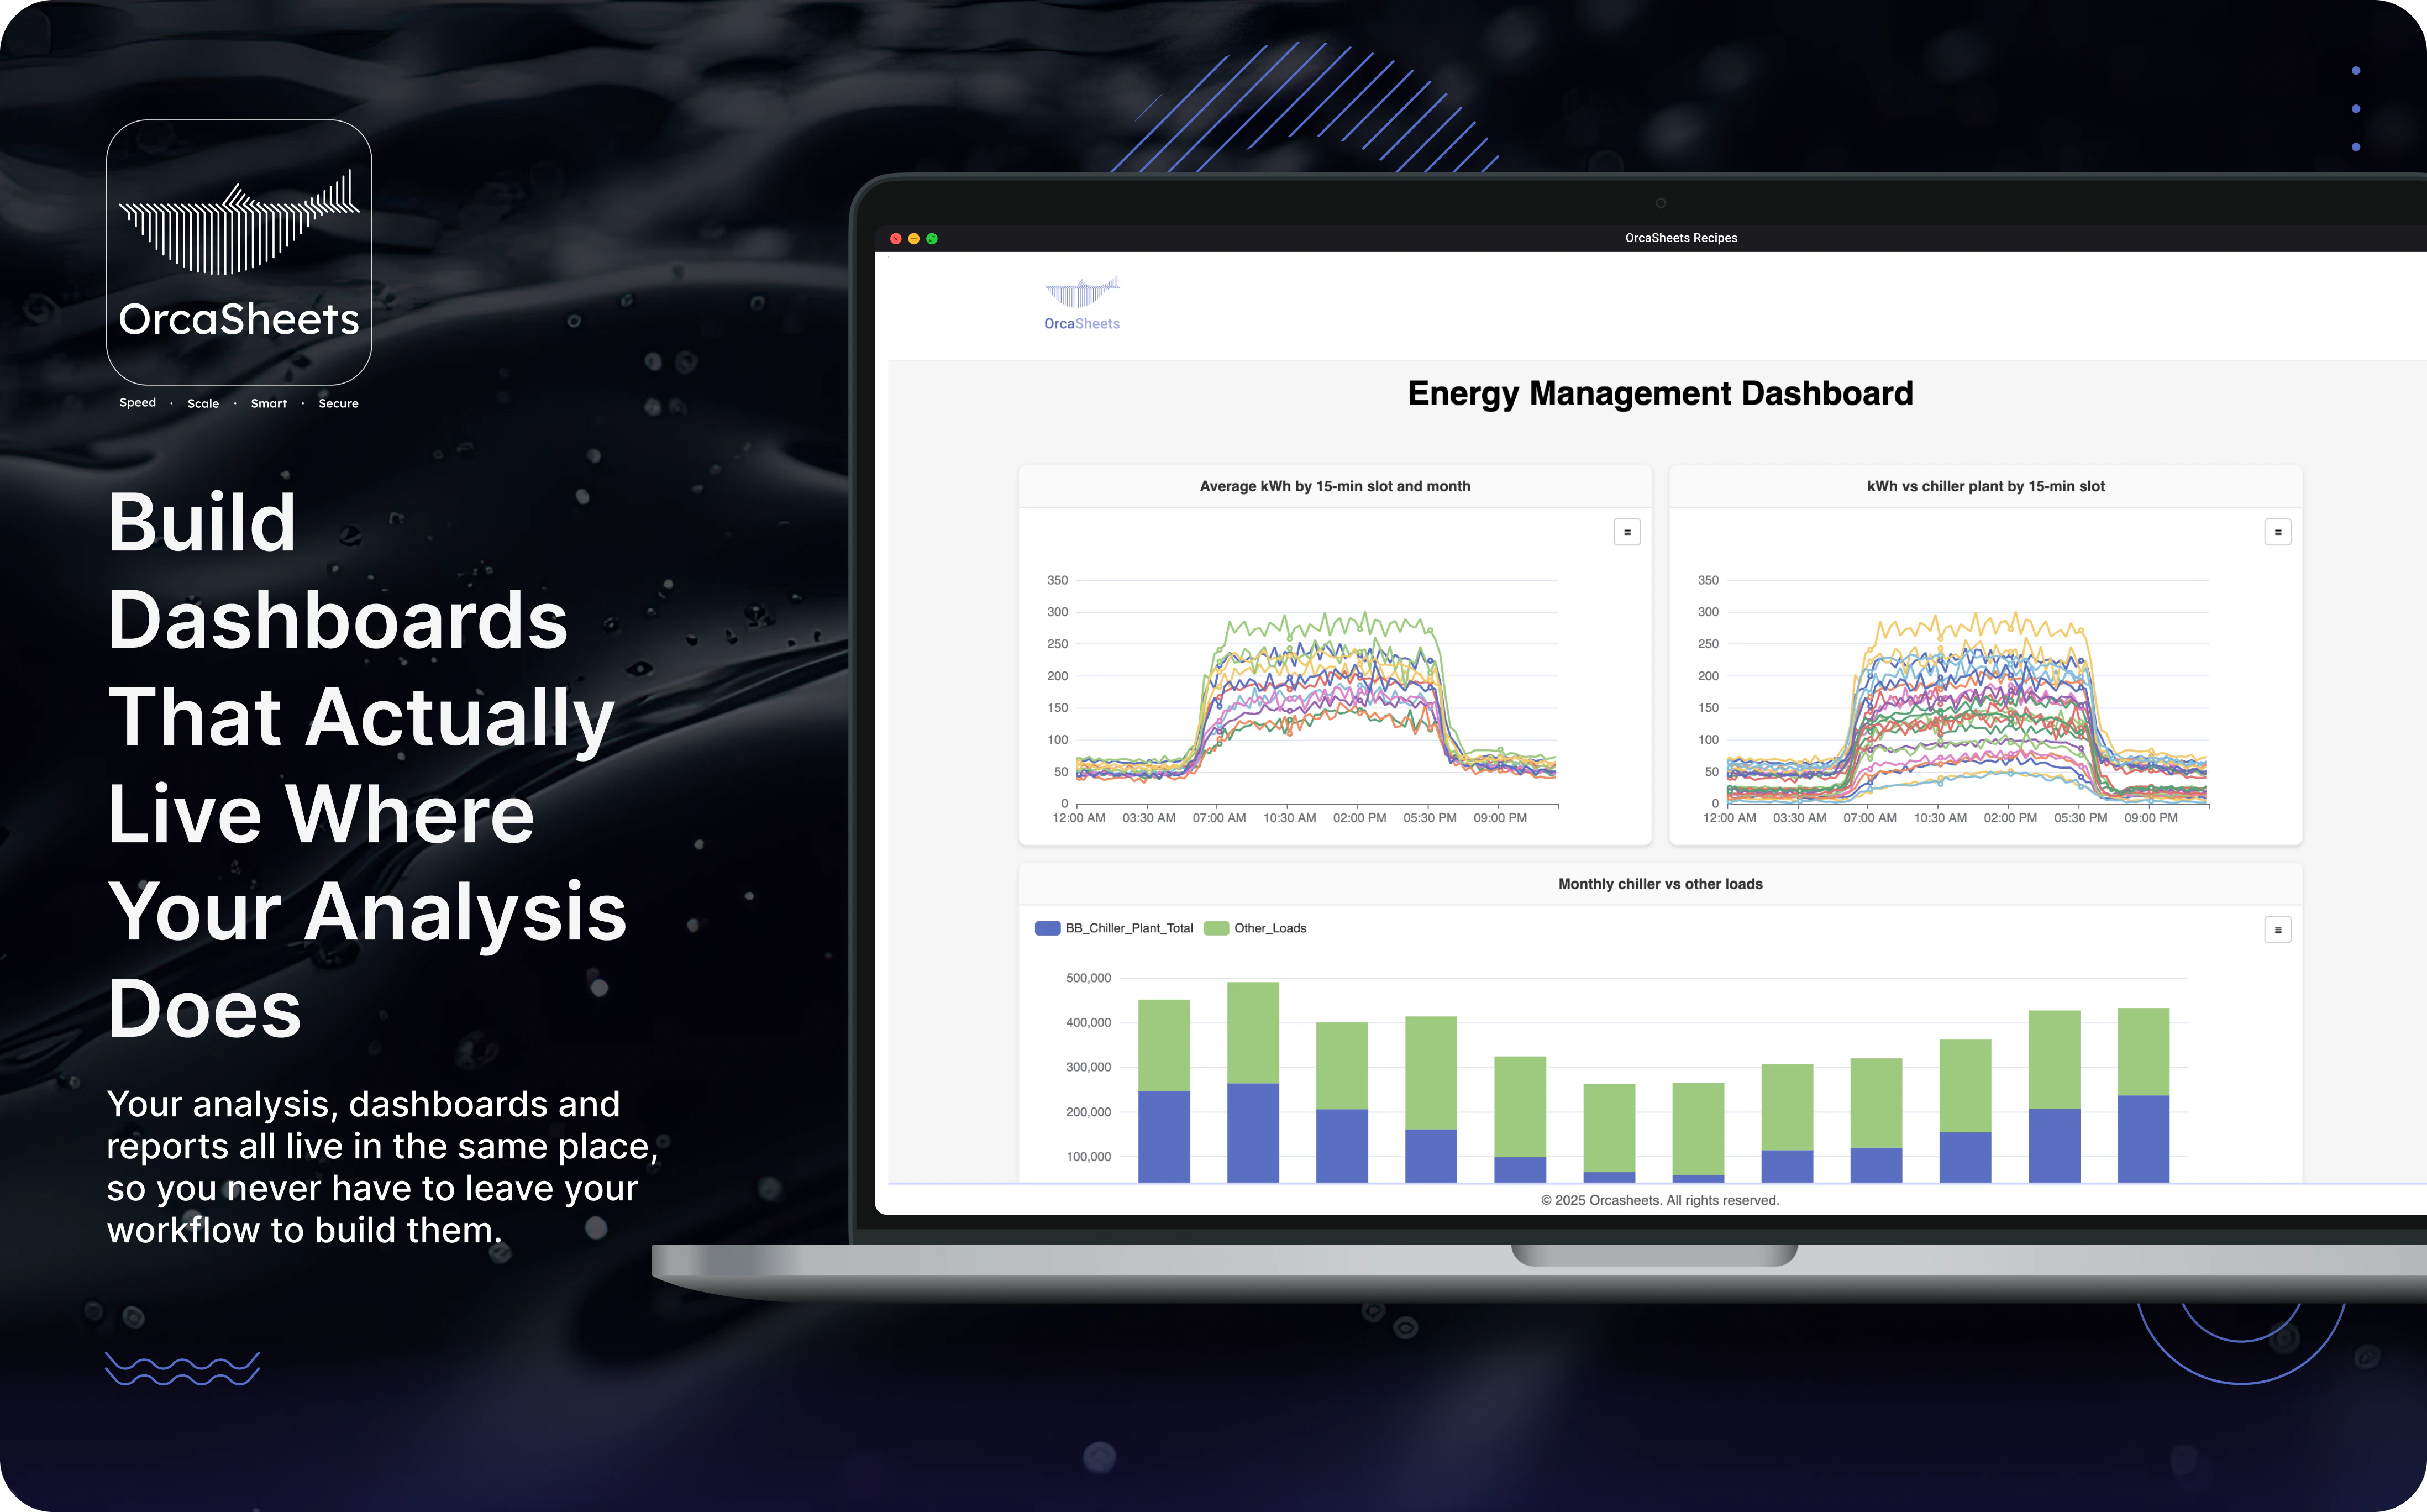
OrcaSheets AI Reports is an innovative analytics tool designed to streamline data reporting and dashboard creation. By leveraging AI-powered queries, users can quickly generate comprehensive reports, including executive summaries, KPIs, insights, and actionable recommendations, all from a single prompt. This tool is ideal for busy professionals in marketing, tech, and business intelligence who want to save time on manual report building and focus on strategic decision-making. Its standout feature is the ability to transform complex data into clear, shareable insights instantly, making data analysis more accessible and efficient for teams of all sizes. OrcaSheets AI Reports simplifies the process of data storytelling, enabling users to produce professional-grade reports without extensive technical expertise.
Screenshots
Pros
- ✓Fast report generation with a single prompt
- ✓Automates complex data analysis and insights
- ✓User-friendly interface suitable for non-technical users
- ✓Supports real-time dashboard updates
- ✓Saves time and reduces manual report building
Cons
- ✗Limited information on customization options
- ✗Potential data privacy concerns depending on data integration
- ✗No detailed pricing or free trial info available
Use Cases
Pricing
Likely operates on a subscription-based model with tiered plans, possibly offering a freemium option with paid plans starting around $20-$50/month, though exact pricing details are not specified.
Quick Info
Topics
Alternatives
Similar Tools in Data & Analytics
Embed Badge
Add this badge to your website to show that OrcaSheets AI Reports is featured on Visalytica.
<a href="https://www.visalytica.com/tool/orcasheets-ai-reports" target="_blank" rel="noopener noreferrer" style="display:inline-flex;align-items:center;gap:6px;padding:6px 14px;background:#7c3aed;color:#fff;border-radius:8px;font-family:-apple-system,system-ui,sans-serif;font-size:13px;font-weight:600;text-decoration:none;transition:background .2s" onmouseover="this.style.background='#6d28d9'" onmouseout="this.style.background='#7c3aed'"><svg width="14" height="14" viewBox="0 0 24 24" fill="none" stroke="currentColor" stroke-width="2.5" stroke-linecap="round" stroke-linejoin="round"><path d="M12 20V10"/><path d="M18 20V4"/><path d="M6 20v-4"/></svg>Featured on Visalytica</a>