
OrangeLabs
Analyze, interpret, and create interactive visuals from data
About OrangeLabs
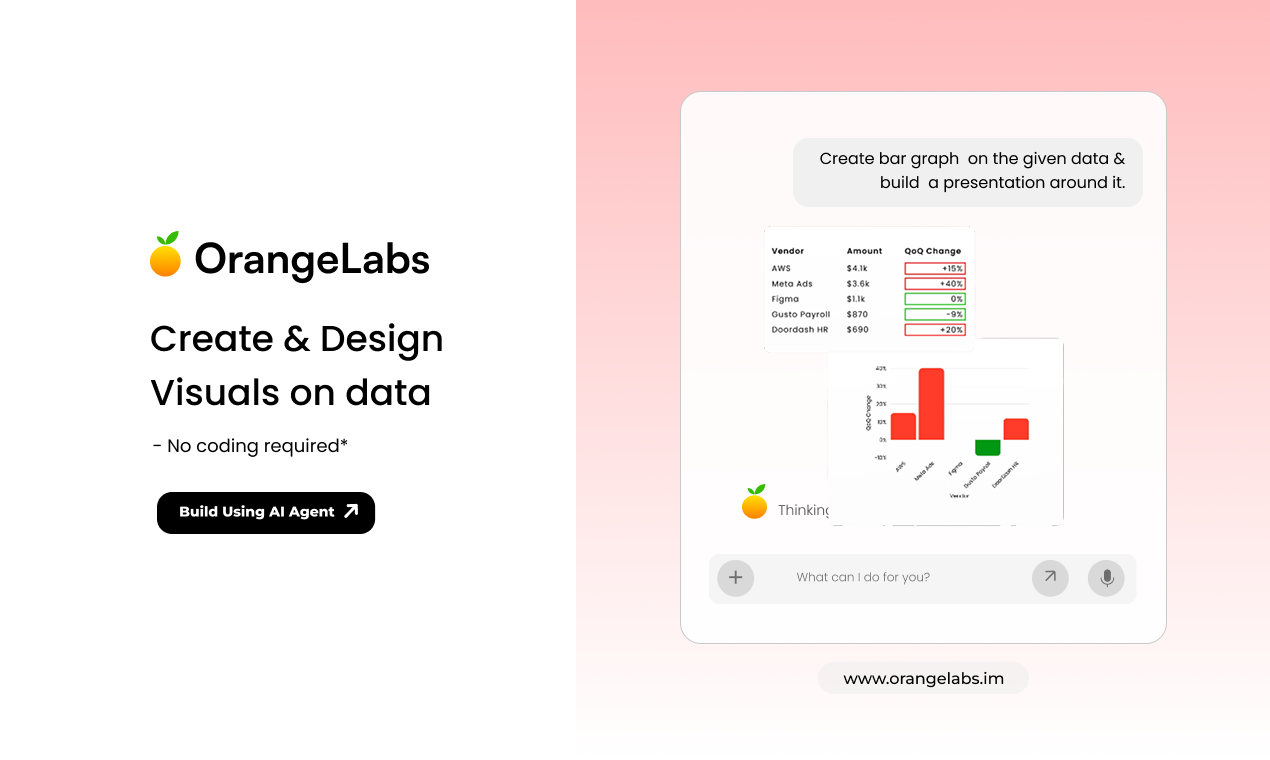
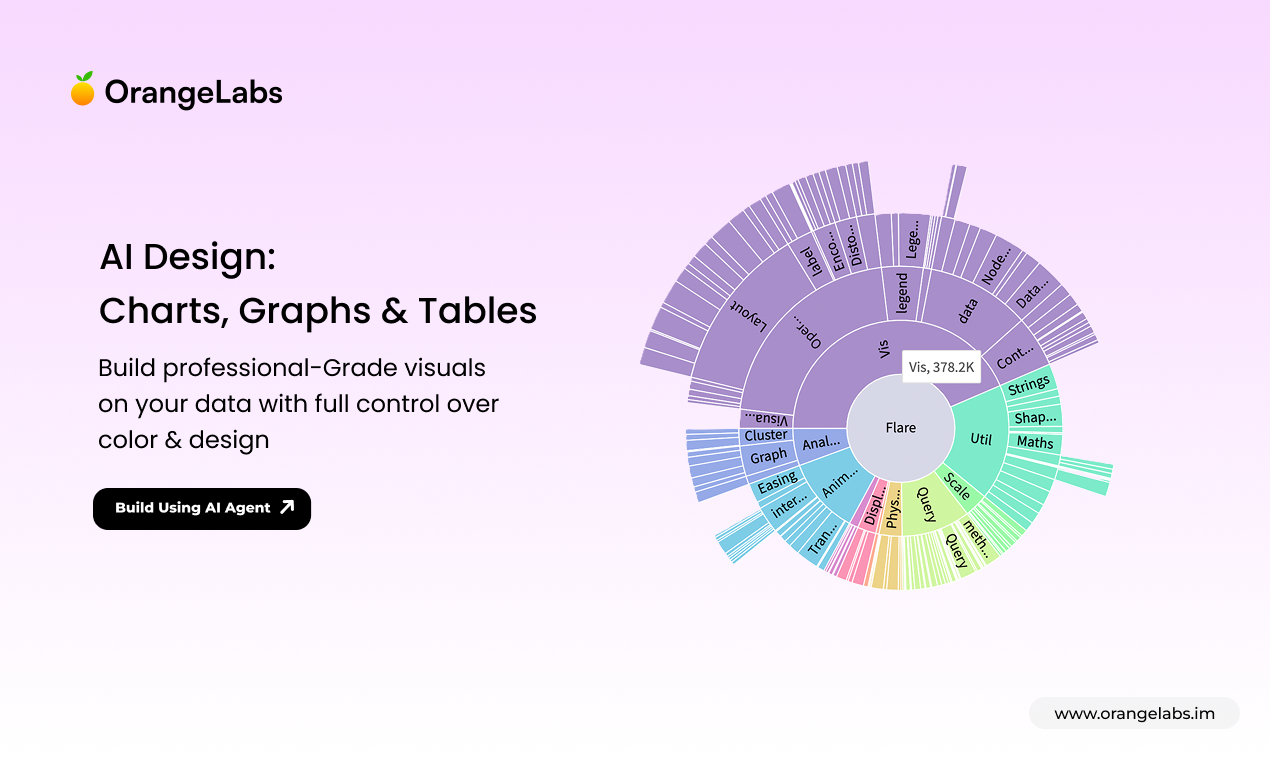
OrangeLabs is an innovative AI-powered data analysis and visualization platform designed for teams, analysts, and decision-makers seeking to simplify complex data workflows. By allowing users to upload or connect data sources, ask natural language questions, and instantly generate tables, charts, and actionable insights, OrangeLabs eliminates the need for manual formulas or coding. Its intuitive interface and AI-driven approach enable users to turn raw spreadsheets into clear, decision-ready visuals within seconds, making data communication more accessible and efficient. What sets OrangeLabs apart is its seamless integration of AI to interpret data context and produce meaningful visualizations without technical expertise, empowering both technical and non-technical users to harness data effectively.
Screenshots



Pros
- ✓No coding or formulas required, user-friendly for non-technical users
- ✓Instant generation of insights, tables, and visualizations
- ✓AI-driven interpretation enhances accuracy and depth of analysis
- ✓Supports easy data upload and connection to various sources
- ✓Ideal for teams aiming for quick, data-informed decisions
Cons
- ✗Limited details on pricing structure, potentially ongoing costs for large datasets
- ✗Dependence on AI accuracy, which may vary with complex or messy data
- ✗Features and integrations might be limited compared to more established BI tools
Use Cases
Pricing
Likely operates on a freemium model with free access to basic features, with paid plans available for advanced functionalities and larger data volumes. Exact pricing details are not specified but may start around a modest monthly fee.
Quick Info
Topics
Similar Tools in Data & Analytics




Embed Badge
Add this badge to your website to show that OrangeLabs is featured on Visalytica.
<a href="https://www.visalytica.com/tool/orangelabs" target="_blank" rel="noopener noreferrer" style="display:inline-flex;align-items:center;gap:6px;padding:6px 14px;background:#7c3aed;color:#fff;border-radius:8px;font-family:-apple-system,system-ui,sans-serif;font-size:13px;font-weight:600;text-decoration:none;transition:background .2s" onmouseover="this.style.background='#6d28d9'" onmouseout="this.style.background='#7c3aed'"><svg width="14" height="14" viewBox="0 0 24 24" fill="none" stroke="currentColor" stroke-width="2.5" stroke-linecap="round" stroke-linejoin="round"><path d="M12 20V10"/><path d="M18 20V4"/><path d="M6 20v-4"/></svg>Featured on Visalytica</a>