
GraphFast v2
The fastest way to create beautiful line graphs
About GraphFast v2
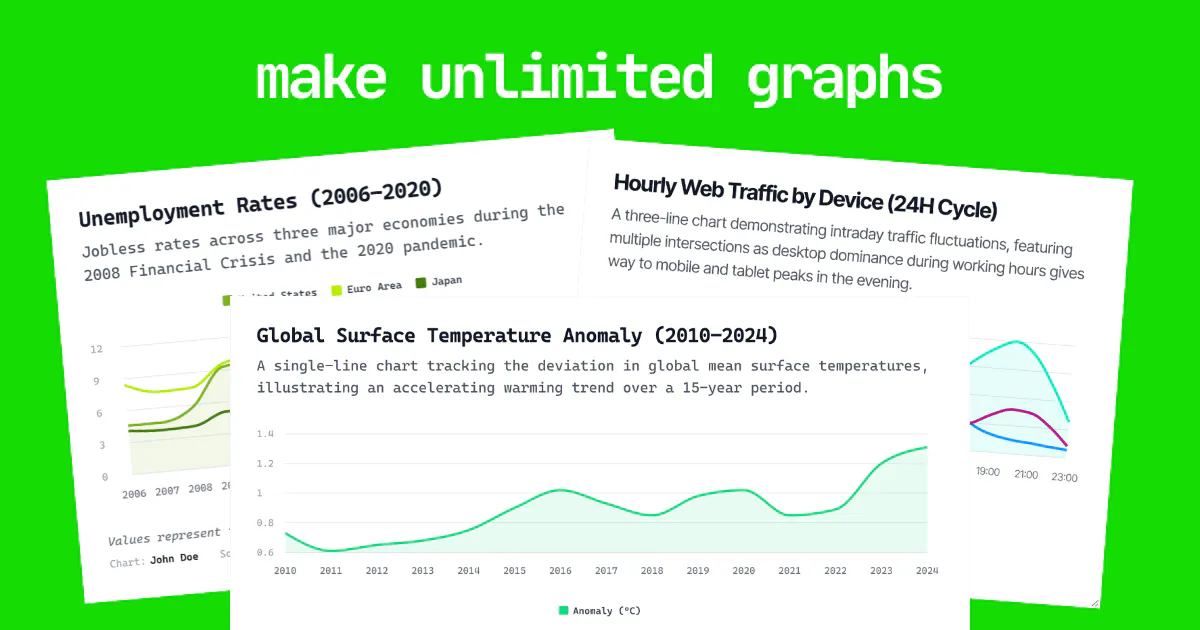
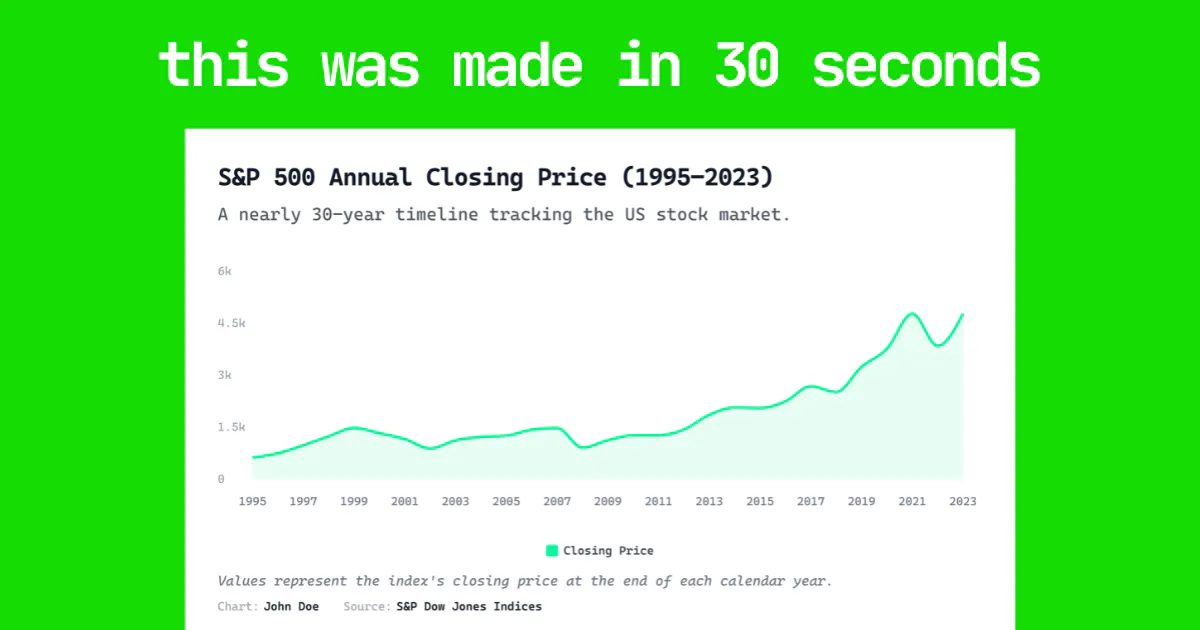
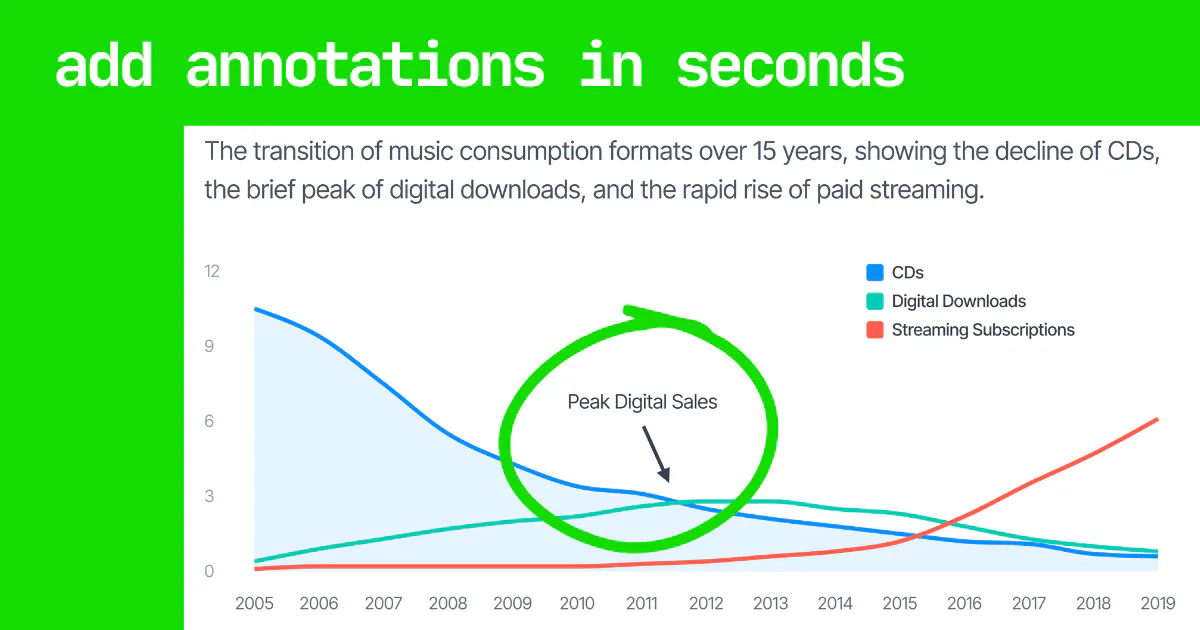
GraphFast v2 stands out as a quick and intuitive tool for creating visually appealing line graphs without the need for complex software or lengthy setup. Designed for data analysts, marketers, educators, and anyone needing to visualize data efficiently, it emphasizes speed and simplicity—users can generate stunning graphs in under two minutes. Its user-friendly interface requires no sign-up, making it accessible and hassle-free for quick visualizations. The tool’s focus on aesthetics combined with ease of use makes it ideal for presentations, reports, or social media sharing where visual impact matters. Although it’s optimized for speed and beauty, it may lack advanced customization options found in more comprehensive data visualization platforms, but for straightforward, beautiful line graphs, GraphFast v2 delivers impressively. Its free, no-registration approach broadens accessibility, making it a compelling choice for quick visual storytelling and data insights.
Screenshots
Pros
- ✓Fast and easy to use, with graph creation in less than 120 seconds
- ✓No sign-up required, providing instant accessibility
- ✓Creates visually stunning and customizable line graphs
- ✓Completely free, removing barriers to entry
- ✓Ideal for quick presentations and social media sharing
Cons
- ✗Limited advanced customization and interactivity options
- ✗Lacks support for complex data sets or multiple chart types
- ✗No collaboration features or export options beyond basic images
Use Cases
Pricing
Likely operates on a freemium model, offering free access with potential premium features or higher-resolution exports available through paid plans, though specifics are uncertain.
Quick Info
Topics
Makers

Saloni Agrawal
Alternatives
Similar Tools in AI Image & Design




Embed Badge
Add this badge to your website to show that GraphFast v2 is featured on Visalytica.
<a href="https://www.visalytica.com/tool/graphfast-v2" target="_blank" rel="noopener noreferrer" style="display:inline-flex;align-items:center;gap:6px;padding:6px 14px;background:#7c3aed;color:#fff;border-radius:8px;font-family:-apple-system,system-ui,sans-serif;font-size:13px;font-weight:600;text-decoration:none;transition:background .2s" onmouseover="this.style.background='#6d28d9'" onmouseout="this.style.background='#7c3aed'"><svg width="14" height="14" viewBox="0 0 24 24" fill="none" stroke="currentColor" stroke-width="2.5" stroke-linecap="round" stroke-linejoin="round"><path d="M12 20V10"/><path d="M18 20V4"/><path d="M6 20v-4"/></svg>Featured on Visalytica</a>