
Global Chokepoints map
An interactive map of where the world breaks
About Global Chokepoints map
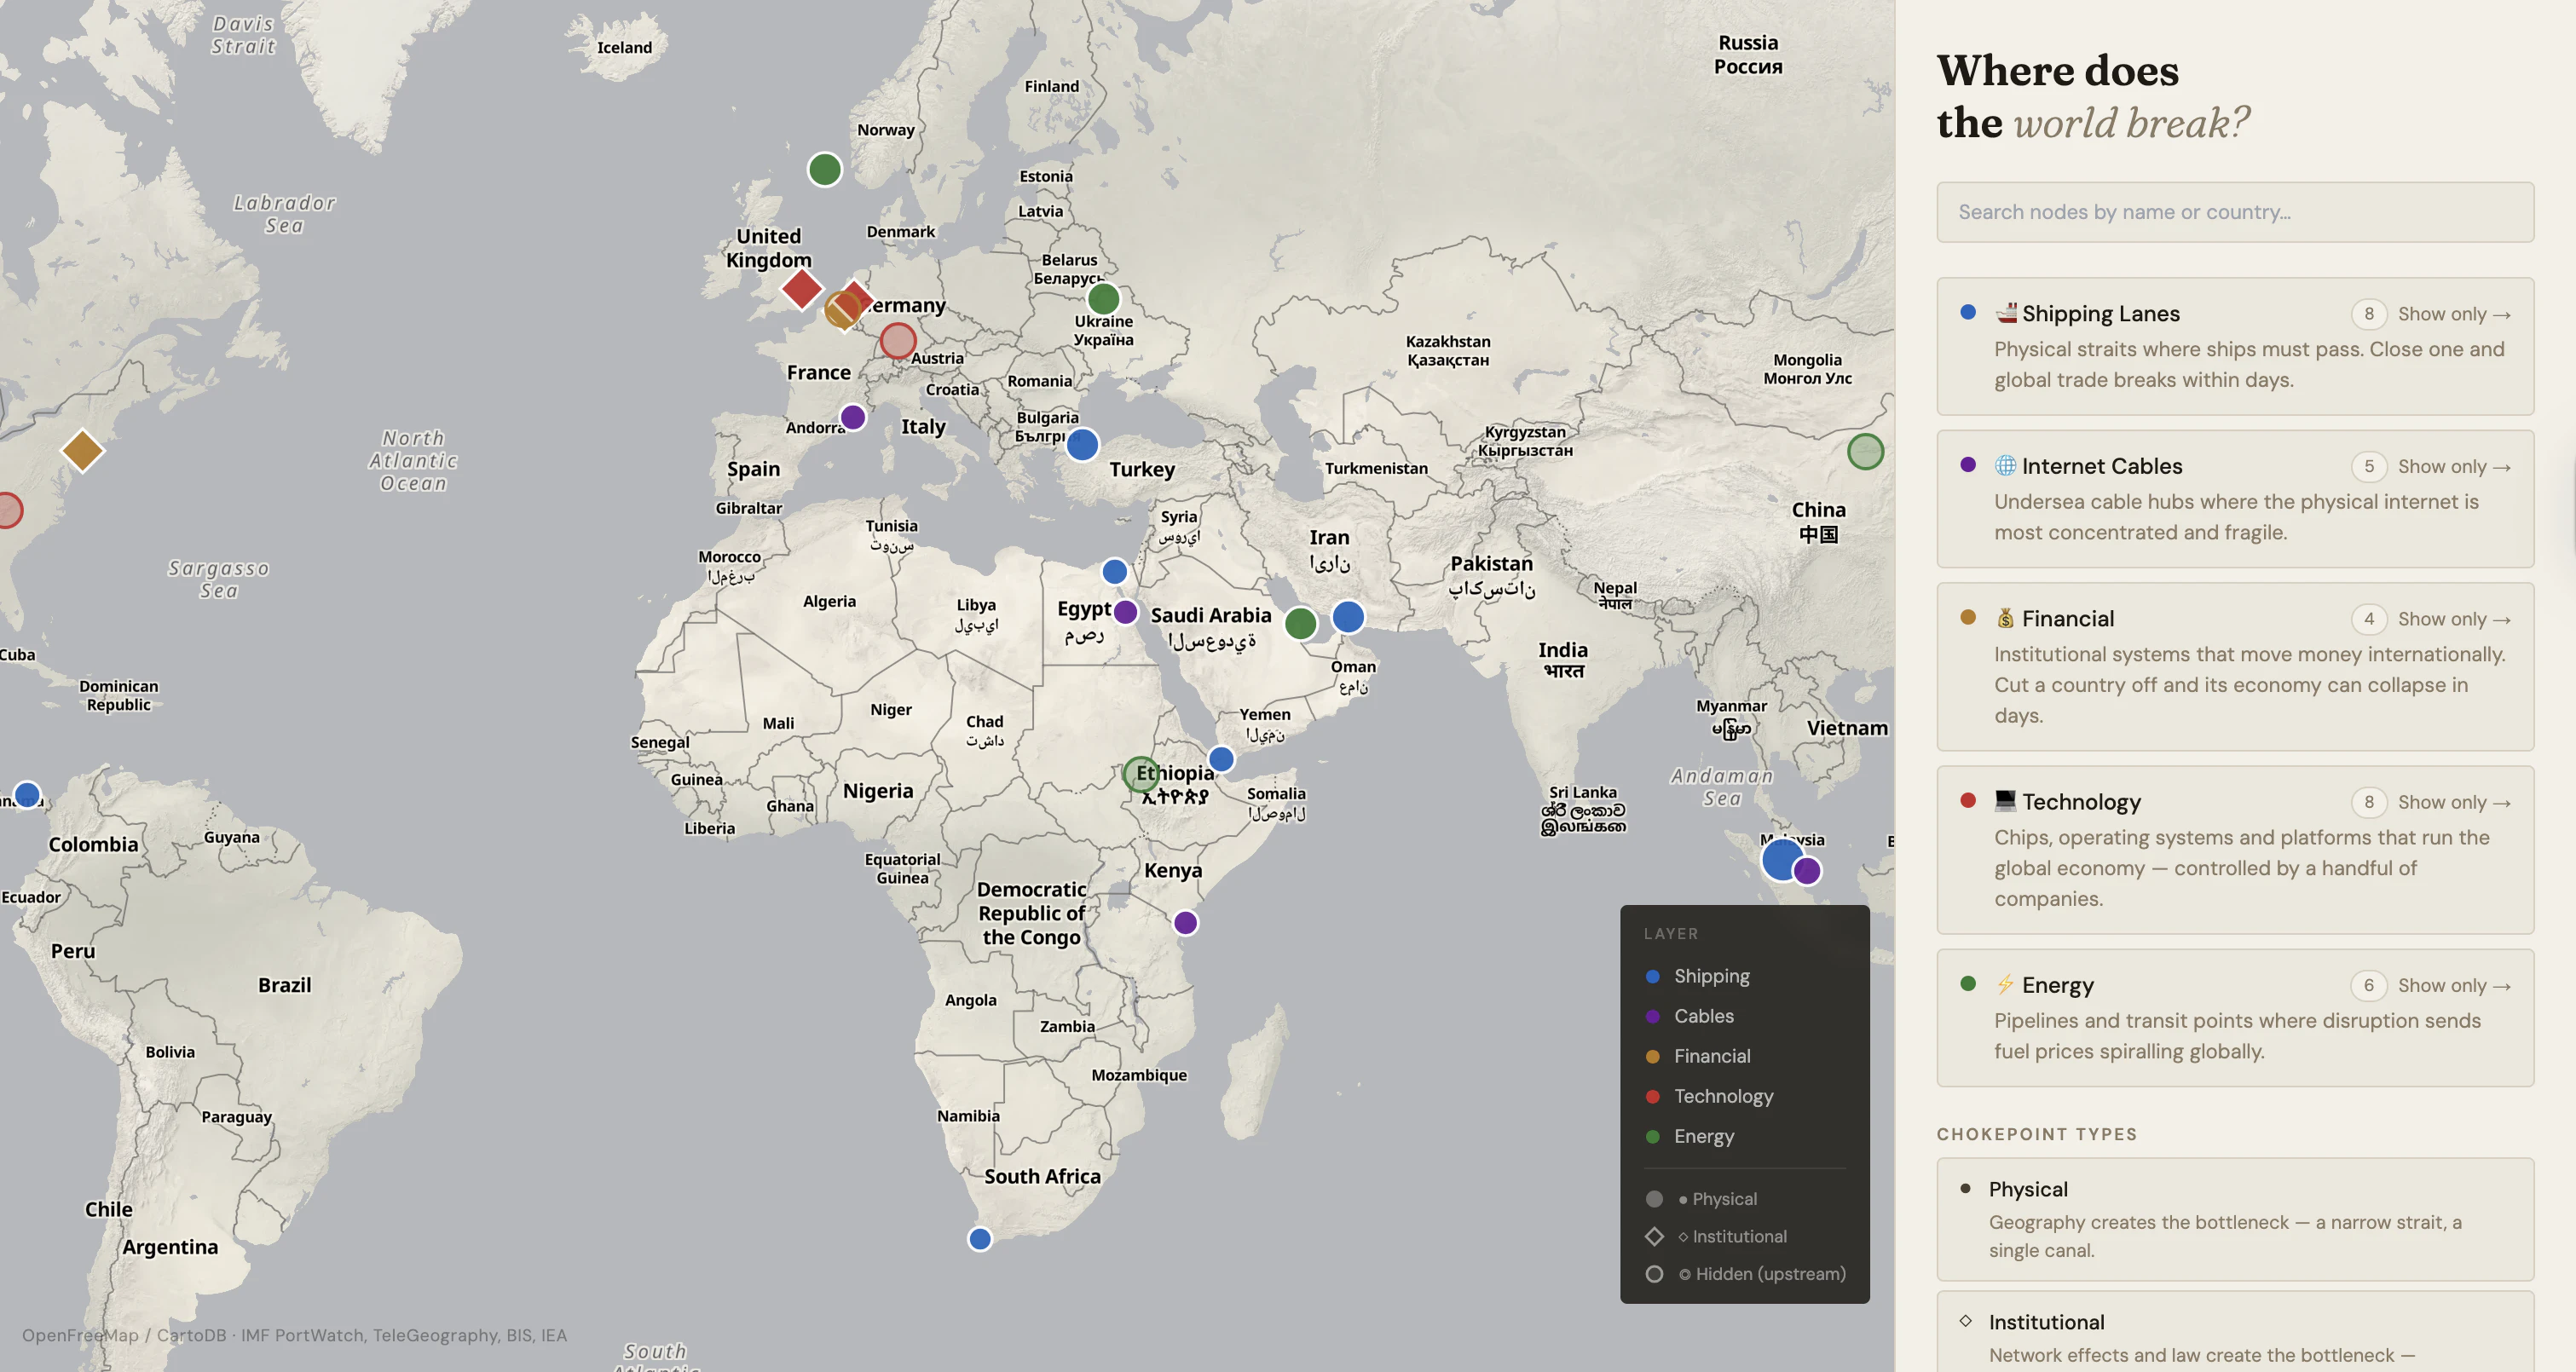
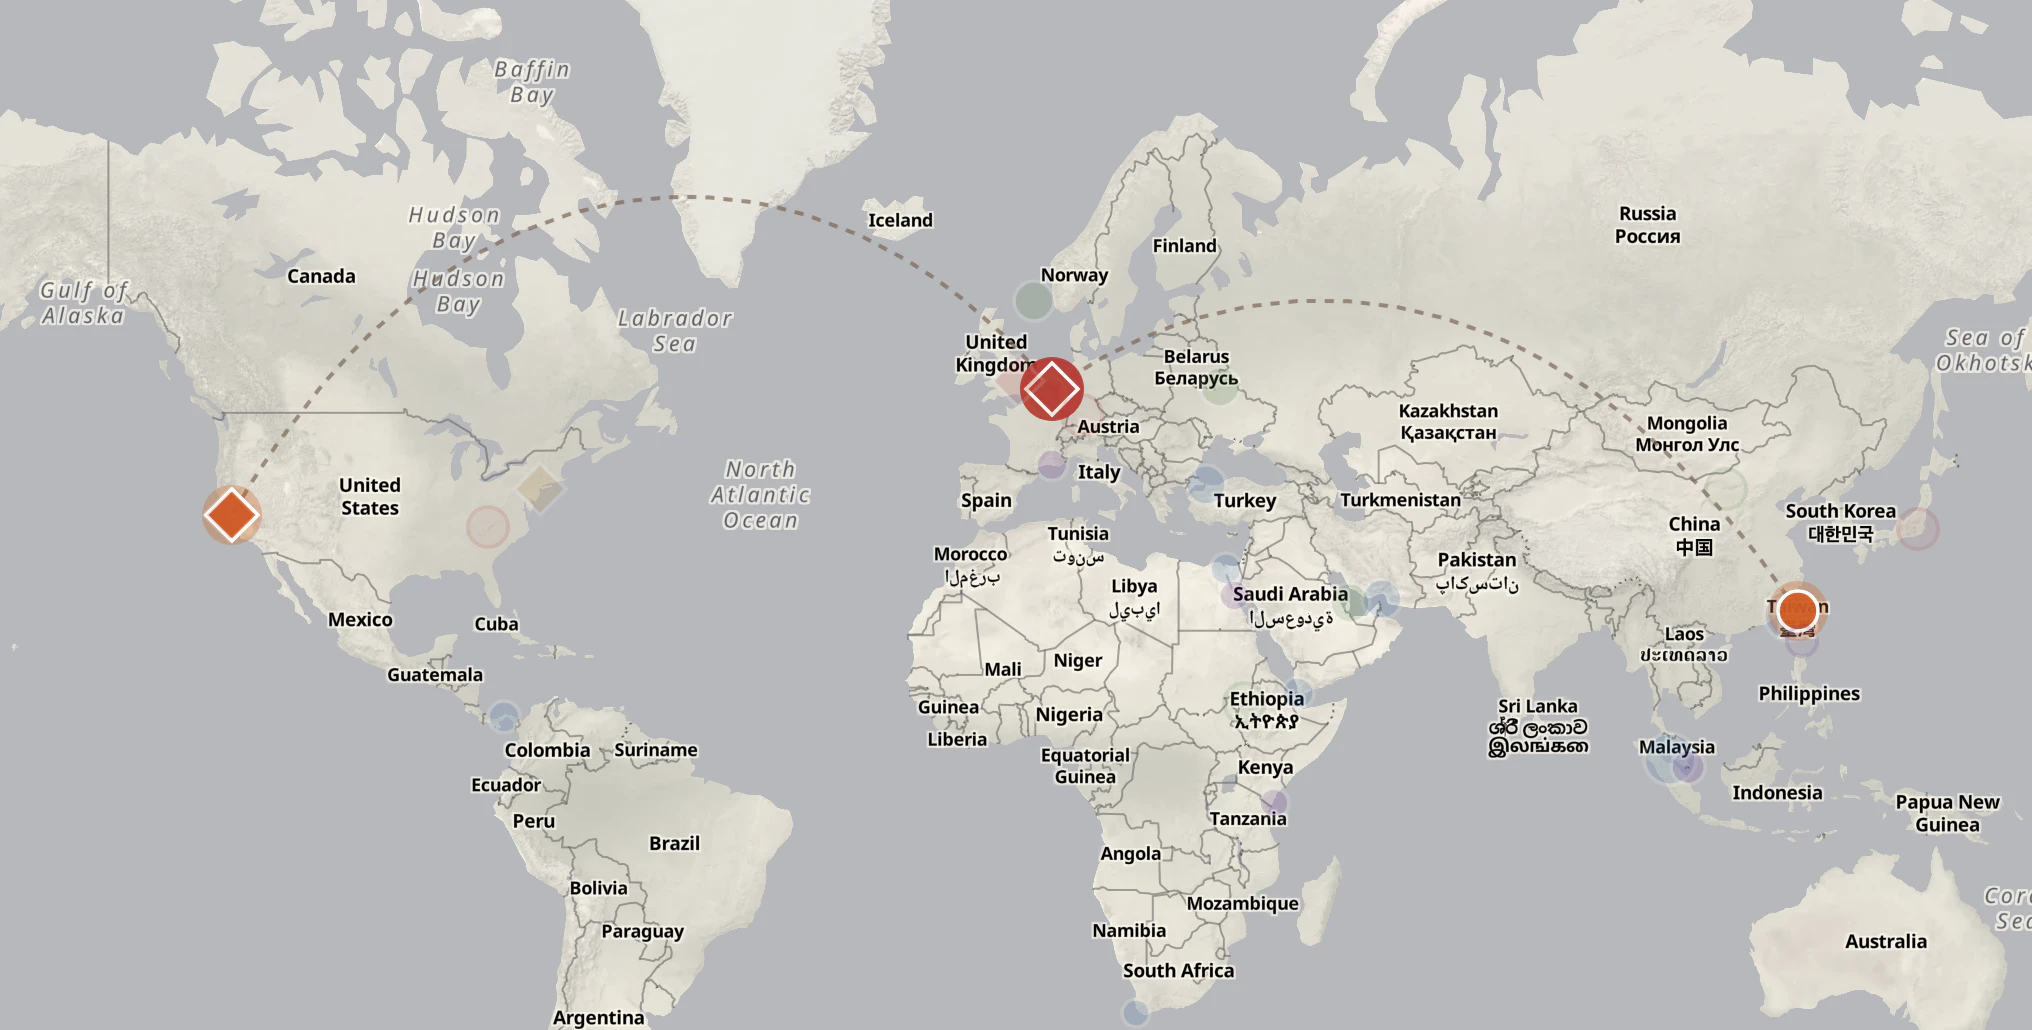
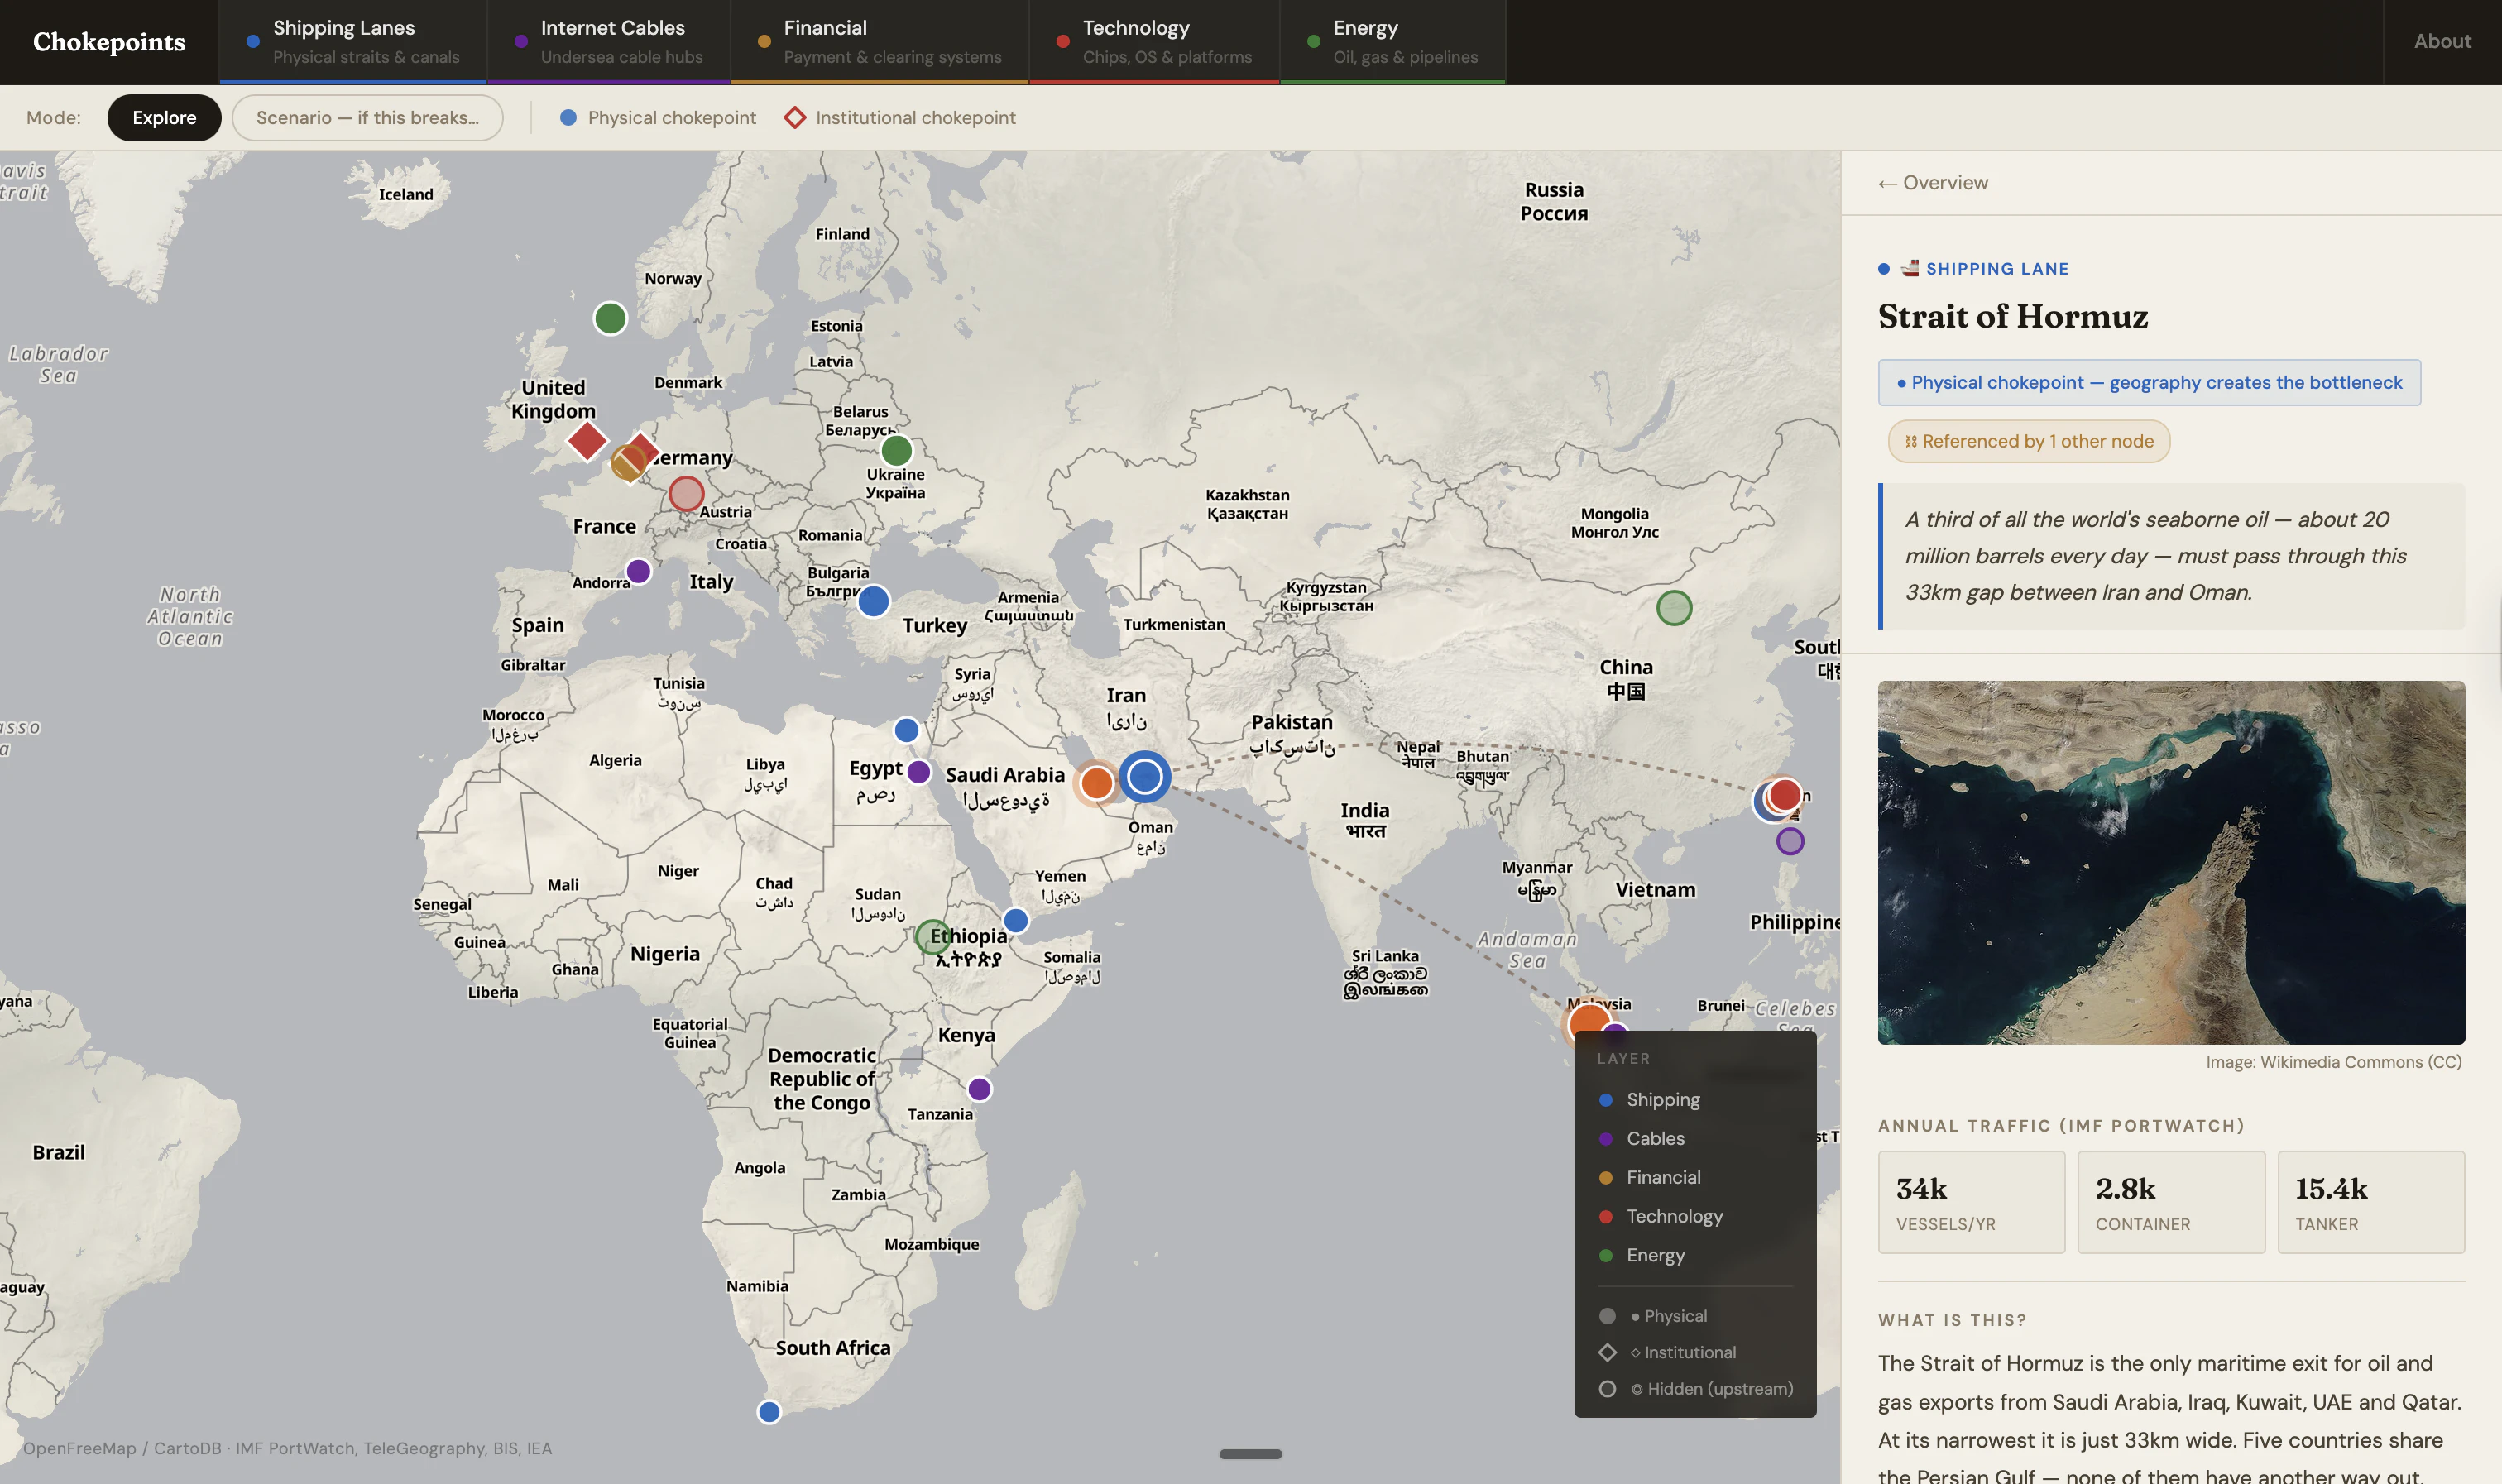
Global Chokepoints map is an open-source interactive visualization tool that highlights critical global infrastructure vulnerabilities across shipping routes, internet cables, finance, energy, and technology sectors. It provides users with a comprehensive view of where the world’s essential systems could fail and the cascading effects that might follow. Built for researchers, policymakers, educators, and infrastructure analysts, this map makes complex global dependencies accessible and understandable. Its open-source nature and intuitive design set it apart, allowing anyone to explore and analyze key chokepoints with ease. By visualizing these crucial vulnerabilities, it helps users grasp the interconnectedness of modern infrastructure and the potential impacts of failures in specific regions or systems.
Screenshots
Pros
- ✓Open-source, promoting transparency and customization
- ✓Interactive and visually engaging data visualization
- ✓Broad coverage of critical global infrastructure sectors
- ✓Accessible for users with varying levels of technical expertise
- ✓Helps identify systemic vulnerabilities and dependencies
Cons
- ✗Potentially limited data granularity or real-time updates
- ✗May require technical skills to fully utilize customization features
- ✗Lacks detailed analysis tools or predictive modeling
Use Cases
Pricing
Free and open source, making it accessible for individual users and organizations without cost barriers.
Quick Info
Topics
Alternatives
Similar Tools in Data & Analytics
Embed Badge
Add this badge to your website to show that Global Chokepoints map is featured on Visalytica.
<a href="https://www.visalytica.com/tool/global-chokepoints-map" target="_blank" rel="noopener noreferrer" style="display:inline-flex;align-items:center;gap:6px;padding:6px 14px;background:#7c3aed;color:#fff;border-radius:8px;font-family:-apple-system,system-ui,sans-serif;font-size:13px;font-weight:600;text-decoration:none;transition:background .2s" onmouseover="this.style.background='#6d28d9'" onmouseout="this.style.background='#7c3aed'"><svg width="14" height="14" viewBox="0 0 24 24" fill="none" stroke="currentColor" stroke-width="2.5" stroke-linecap="round" stroke-linejoin="round"><path d="M12 20V10"/><path d="M18 20V4"/><path d="M6 20v-4"/></svg>Featured on Visalytica</a>