
Free chart generator by Embedful
Turn CSV & Excel files into charts in seconds
About Free chart generator by Embedful
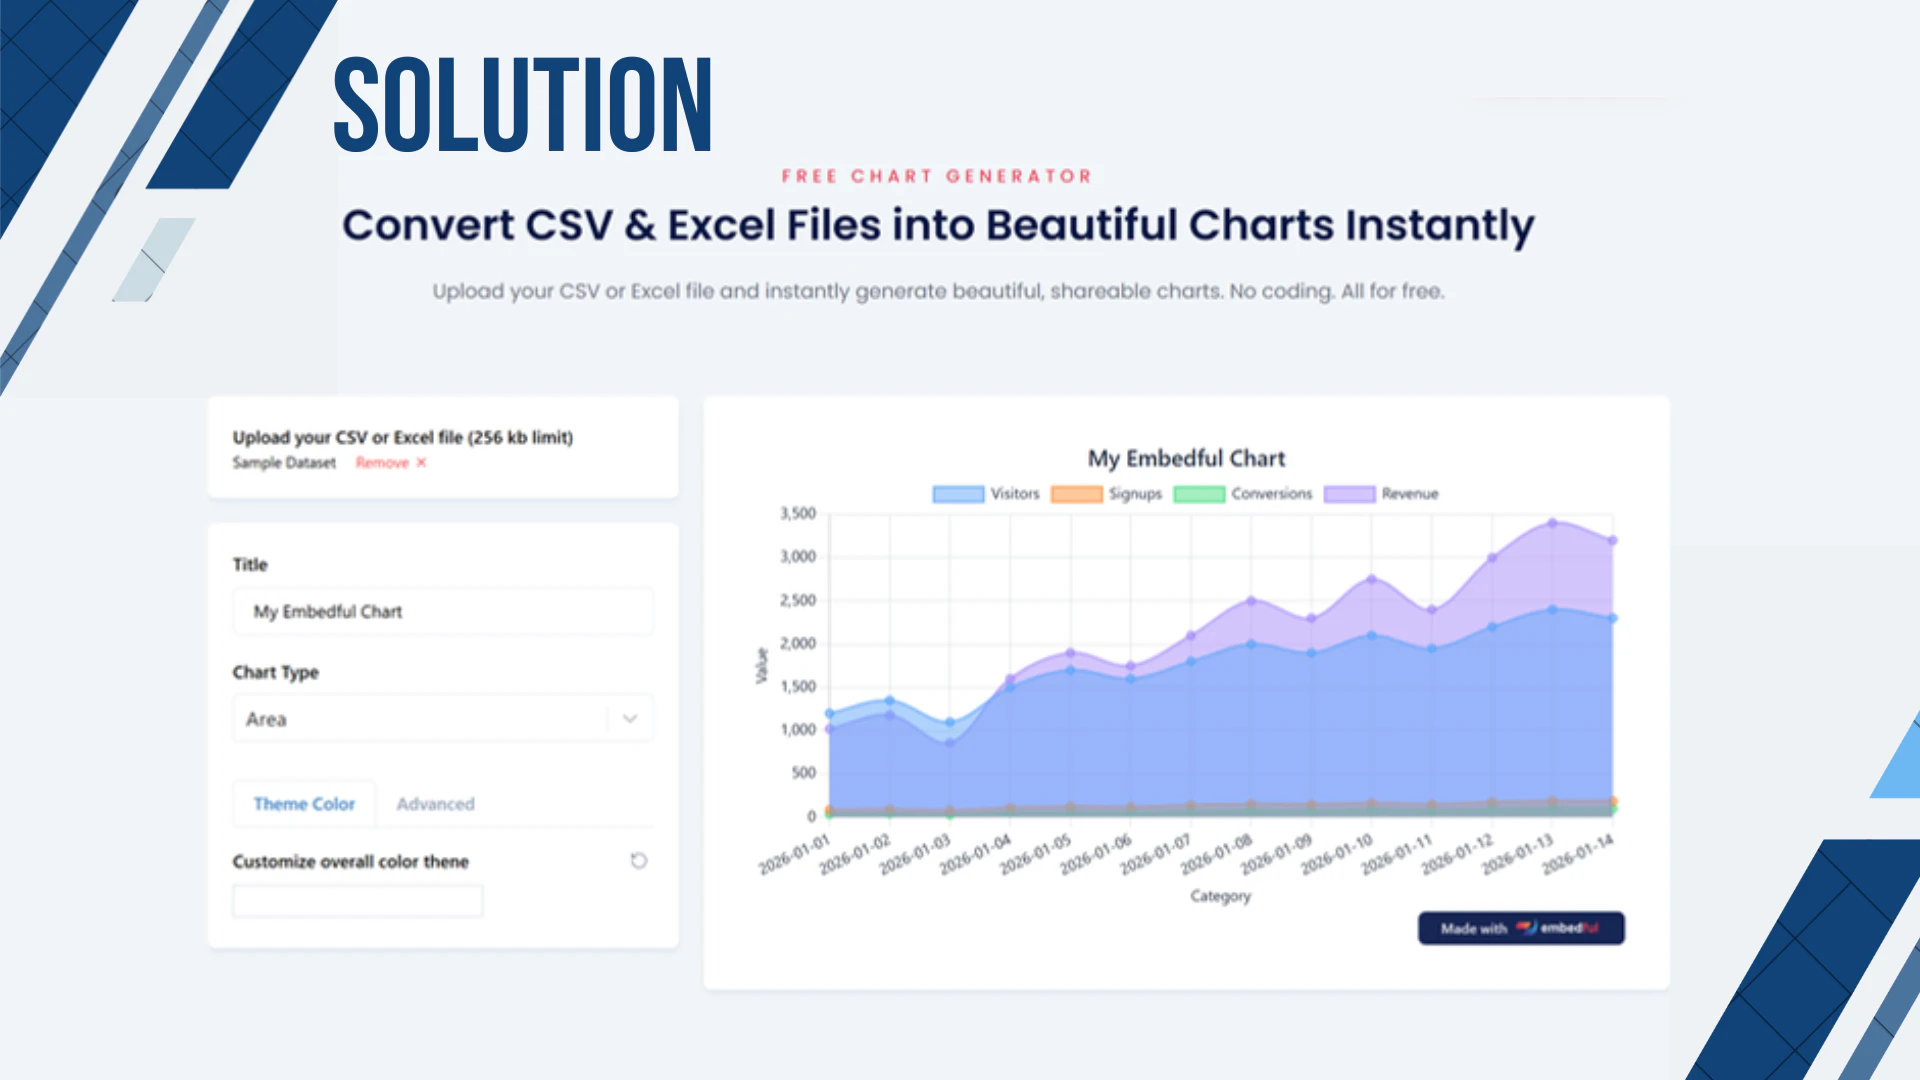
The Free Chart Generator by Embedful is a straightforward, no-cost tool designed to transform CSV and Excel data files into visually appealing, presentation-ready charts within seconds. Its user-friendly interface requires no coding or setup, making it accessible for professionals, students, and casual users alike who need quick data visualization solutions. Users simply upload their data, customize the visual style, and export the resulting charts in popular formats like PNG, SVG, or PDF, ideal for reports, presentations, and dashboards. What makes this tool stand out is its emphasis on simplicity and speed, allowing users to generate clear, professional visuals without any technical barriers. Its completely free model encourages experimentation and frequent use, especially for those who need fast, reliable chart creation without investing in complex software.
Screenshots
Pros
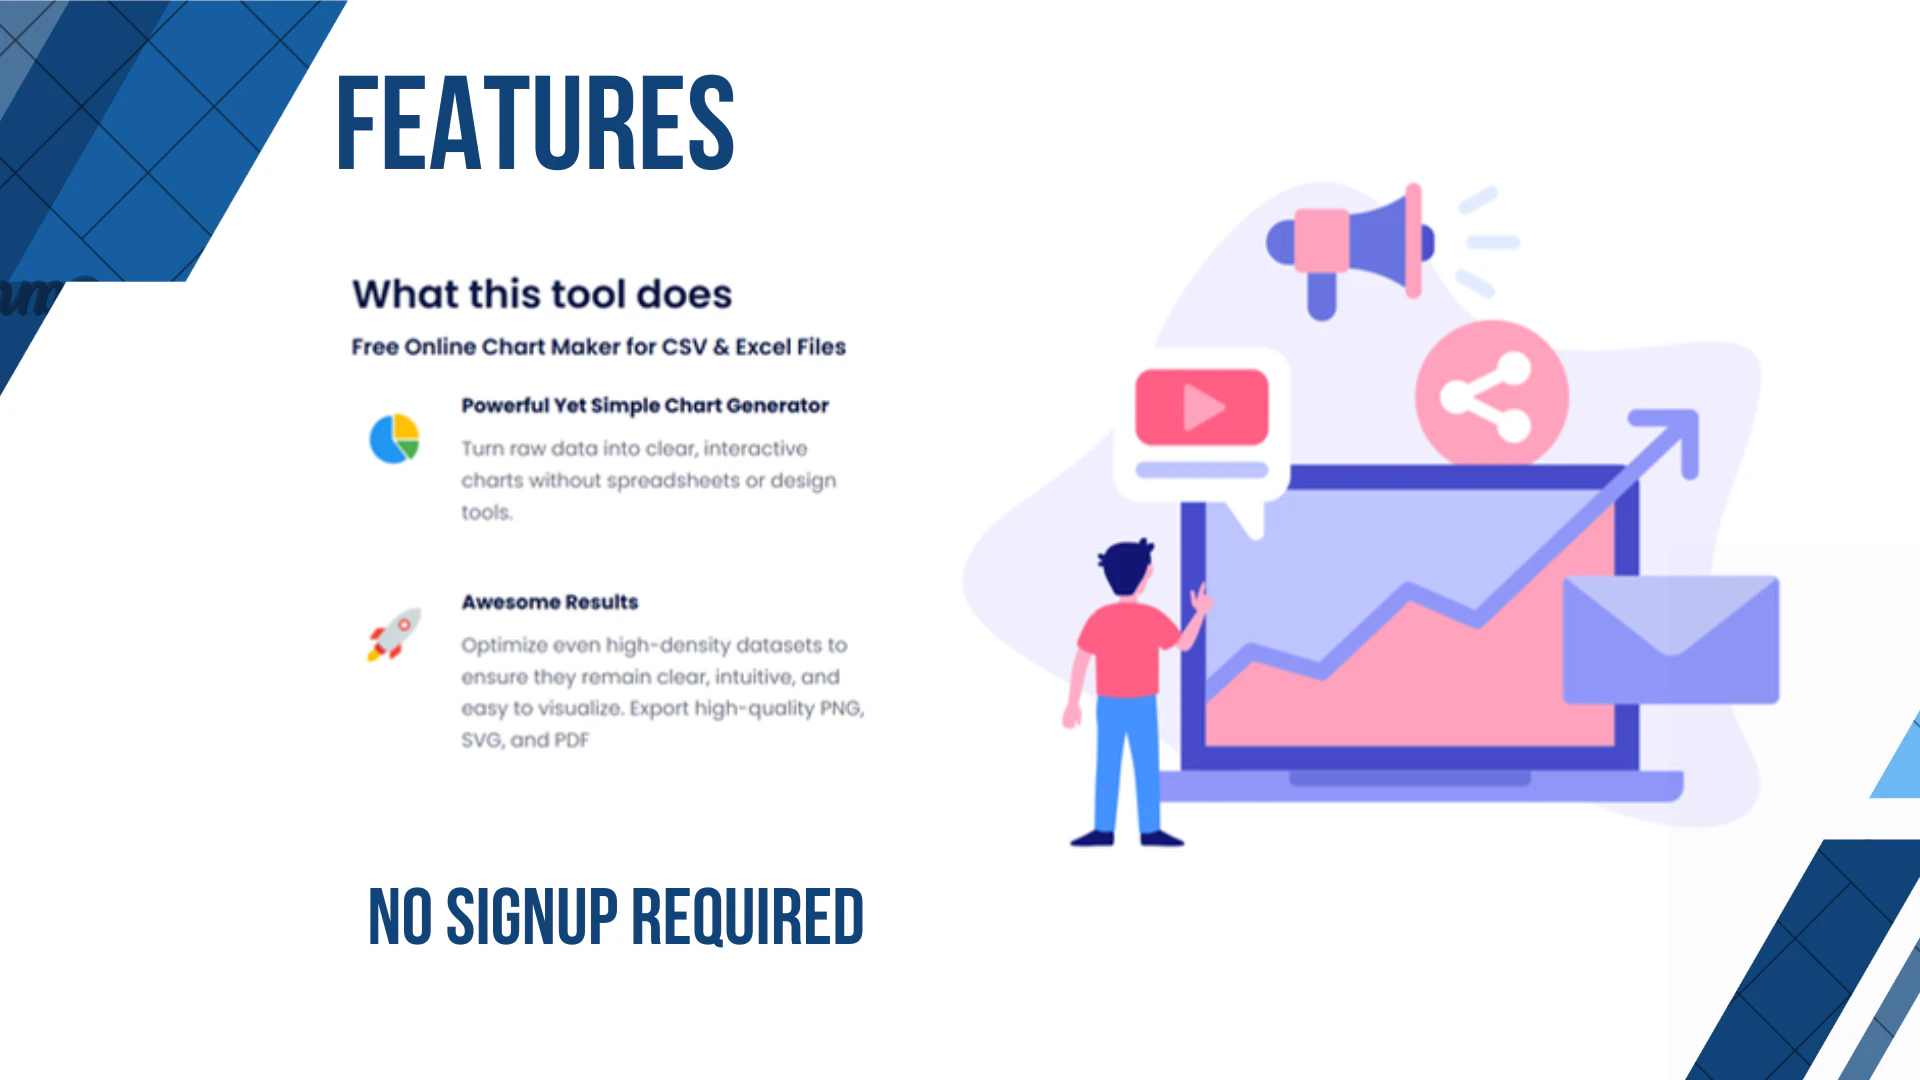
- ✓Easy to use with no coding or technical skills required
- ✓Fast, real-time data transformation into charts
- ✓Supports multiple export formats (PNG, SVG, PDF)
- ✓Completely free, no hidden costs or subscriptions
- ✓Ideal for quick, presentation-ready visualizations
Cons
- ✗Limited customization options compared to advanced tools
- ✗Basic features may not satisfy complex or large datasets
- ✗Lacks integration with other data tools or automation capabilities
Use Cases
Pricing
Likely operates on a free model, offering unlimited access without charges, given its emphasis on being completely free and no registration requirements. There may be premium features in future or additional offerings, but current usage appears to be entirely free.
Quick Info
Topics
Alternatives
Similar Tools in AI Image & Design
Embed Badge
Add this badge to your website to show that Free chart generator by Embedful is featured on Visalytica.
<a href="https://www.visalytica.com/tool/free-chart-generator-by-embedful" target="_blank" rel="noopener noreferrer" style="display:inline-flex;align-items:center;gap:6px;padding:6px 14px;background:#7c3aed;color:#fff;border-radius:8px;font-family:-apple-system,system-ui,sans-serif;font-size:13px;font-weight:600;text-decoration:none;transition:background .2s" onmouseover="this.style.background='#6d28d9'" onmouseout="this.style.background='#7c3aed'"><svg width="14" height="14" viewBox="0 0 24 24" fill="none" stroke="currentColor" stroke-width="2.5" stroke-linecap="round" stroke-linejoin="round"><path d="M12 20V10"/><path d="M18 20V4"/><path d="M6 20v-4"/></svg>Featured on Visalytica</a>