Dashi Metrics
Visualize your revenue on a 3D globe
About Dashi Metrics
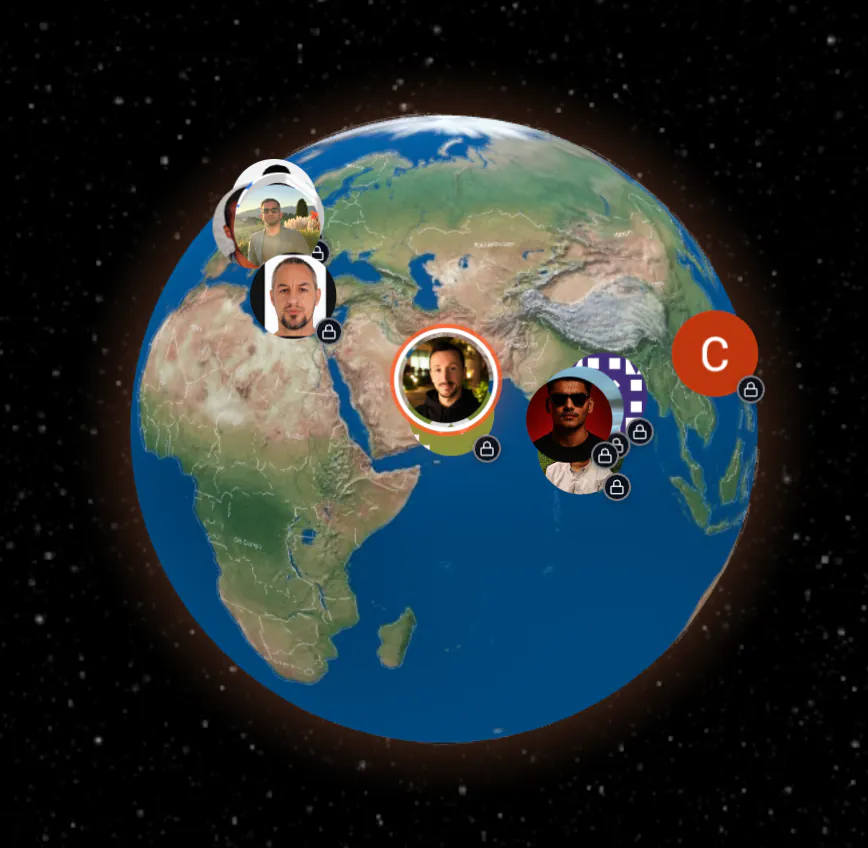
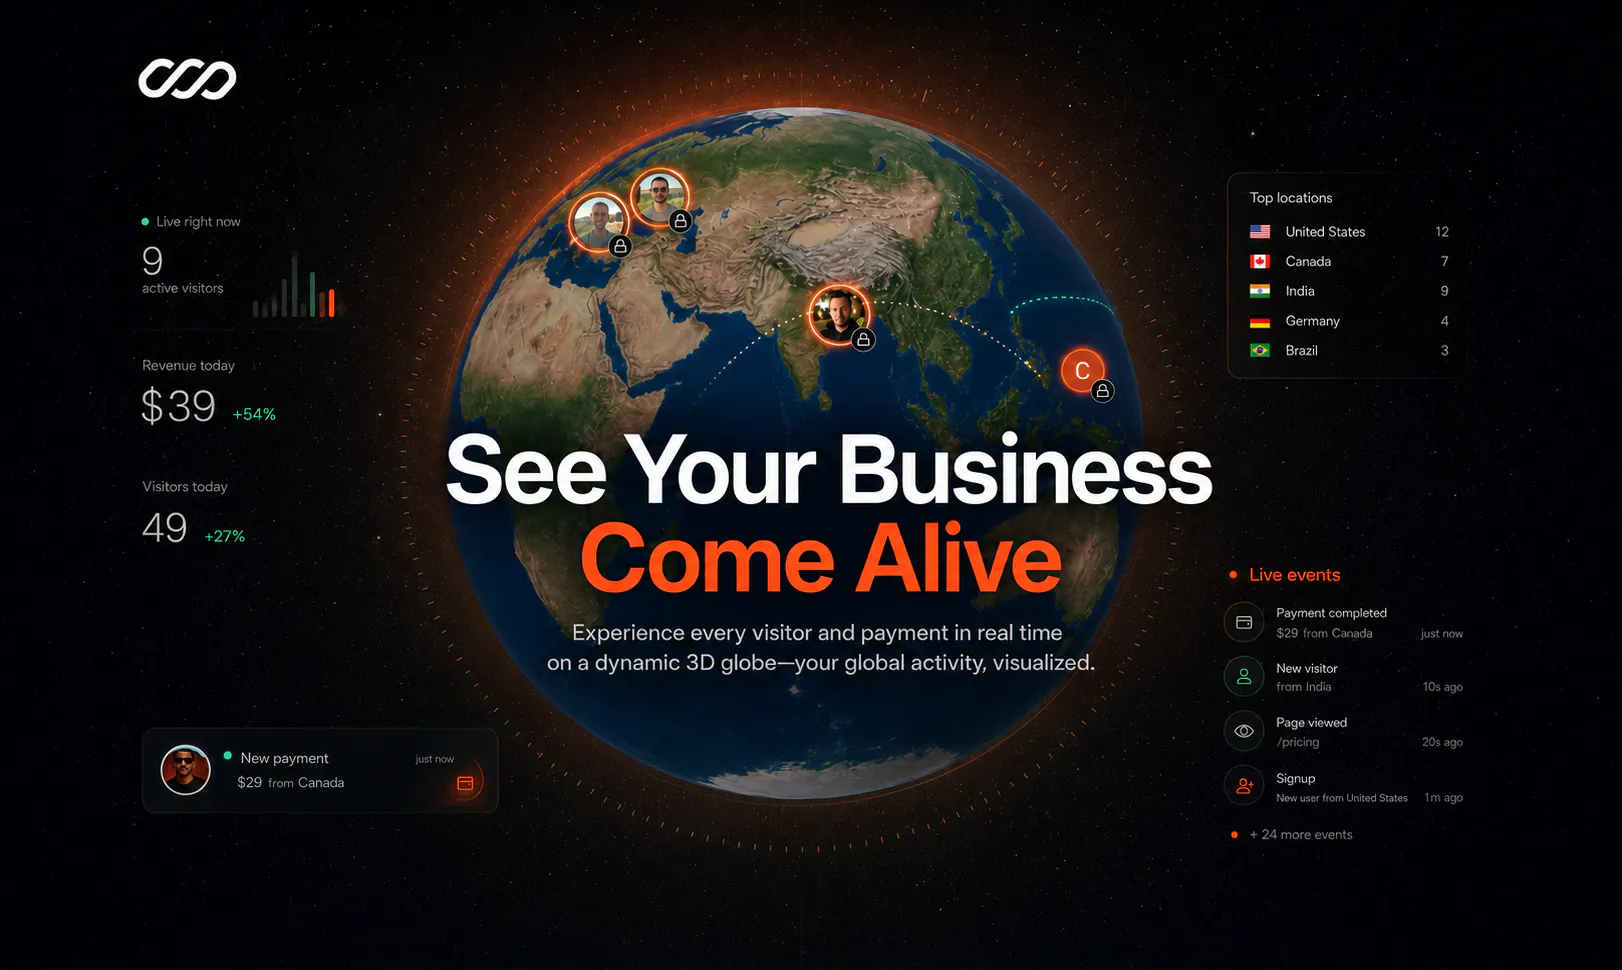
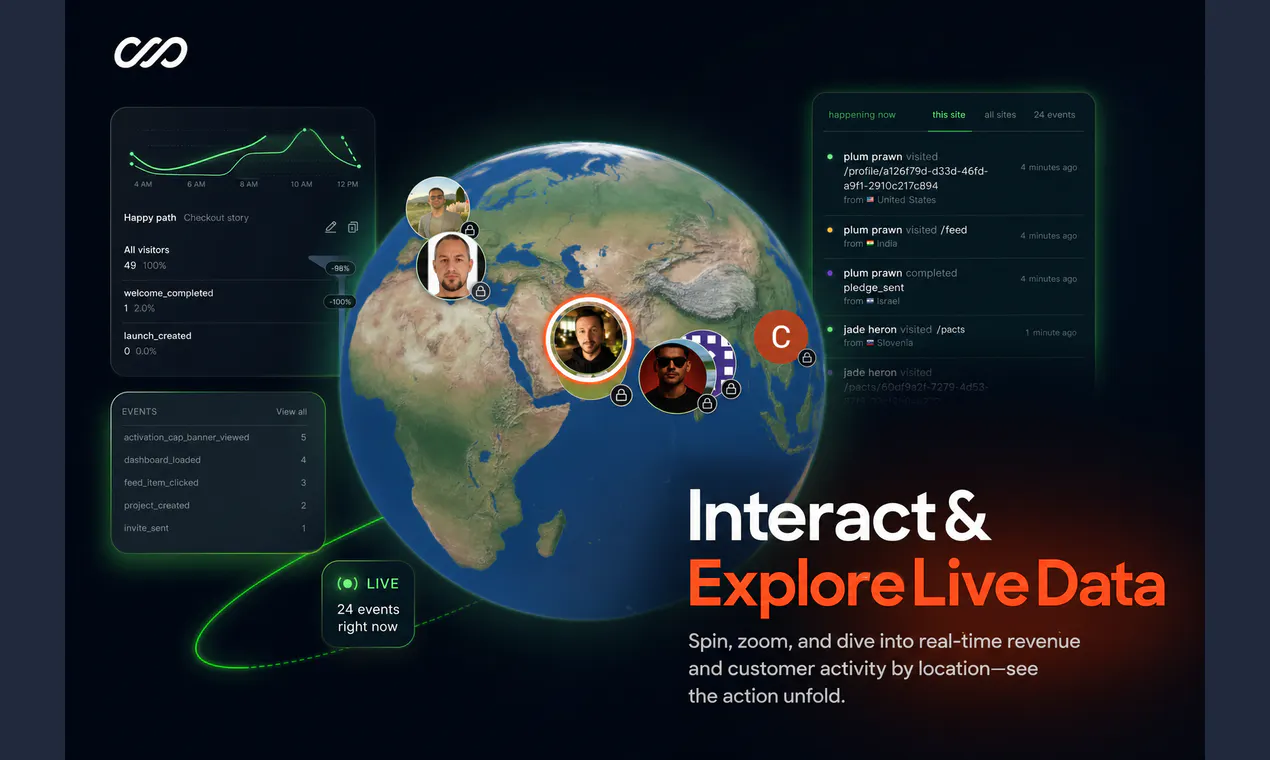
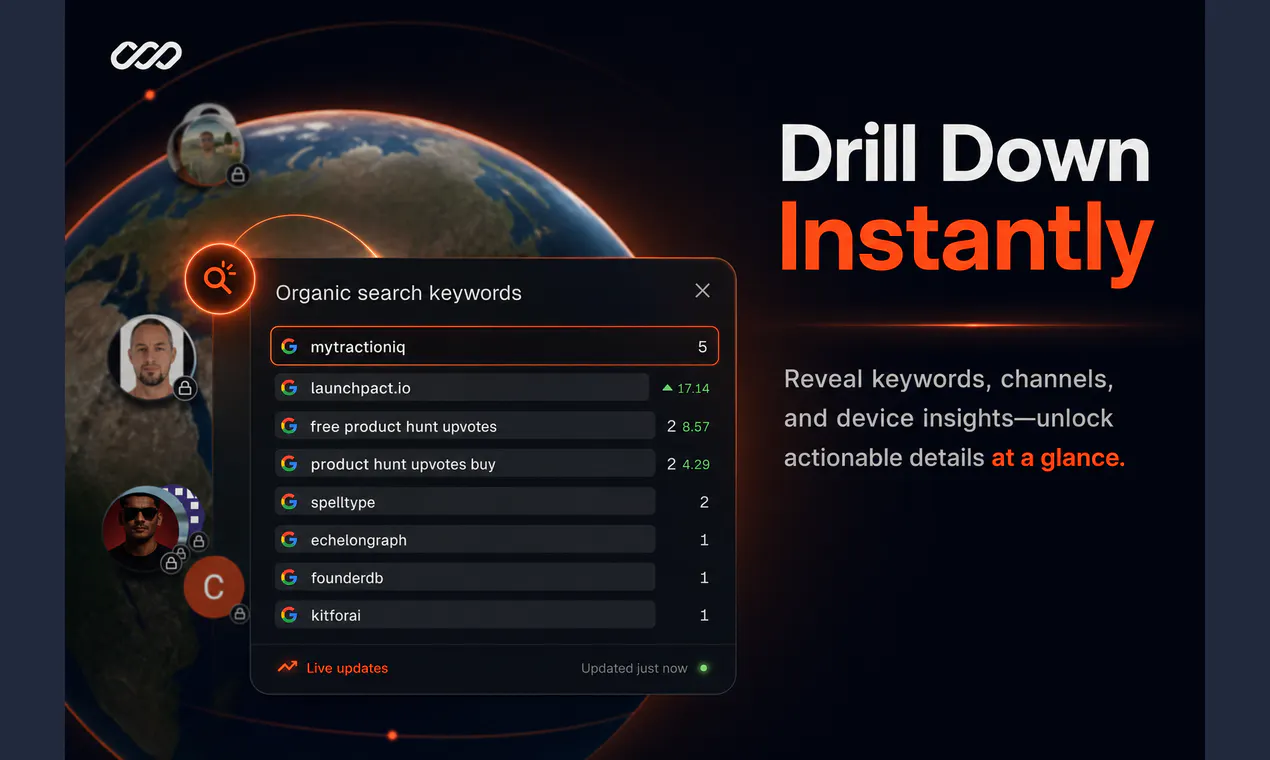
Dashi Metrics transforms traditional business analytics by providing a visually stunning, real-time 3D globe that maps every visitor and payment activity across the world. Designed for SaaS teams, founders, and data enthusiasts, it offers an immersive way to monitor global customer engagement and revenue streams. Unlike static dashboards, Dashi’s interactive globe allows users to spin, zoom, and explore their data dynamically, making insights more engaging and accessible. Its innovative visualization makes it easier to identify geographic trends, monitor live activity, and make data-driven decisions instantly. Perfect for teams seeking a compelling way to present complex data, Dashi elevates analytics from mundane charts to a lively, geographic storytelling experience.
Screenshots



Pros
- ✓Interactive 3D globe provides engaging, real-time visualizations
- ✓Helps identify geographic trends and customer hotspots instantly
- ✓User-friendly interface for easy exploration of live data
- ✓Enhances presentations and stakeholder reports with visual impact
- ✓Ideal for SaaS teams looking to make data more accessible and engaging
Cons
- ✗Limited information on pricing and scalability options
- ✗May require a learning curve for new users unfamiliar with 3D visualizations
- ✗Potential performance issues with very large datasets or slow internet connections
Use Cases
Pricing
Likely operates on a freemium model with free basic features and paid plans that may start around $10-$50 per month, depending on data volume and advanced features. Exact pricing details are not publicly confirmed.
Quick Info
Topics
Makers

Dev Tanna
Alternatives
Similar Tools in Data & Analytics




Embed Badge
Add this badge to your website to show that Dashi Metrics is featured on Visalytica.
<a href="https://www.visalytica.com/tool/dashi-metrics" target="_blank" rel="noopener noreferrer" style="display:inline-flex;align-items:center;gap:6px;padding:6px 14px;background:#7c3aed;color:#fff;border-radius:8px;font-family:-apple-system,system-ui,sans-serif;font-size:13px;font-weight:600;text-decoration:none;transition:background .2s" onmouseover="this.style.background='#6d28d9'" onmouseout="this.style.background='#7c3aed'"><svg width="14" height="14" viewBox="0 0 24 24" fill="none" stroke="currentColor" stroke-width="2.5" stroke-linecap="round" stroke-linejoin="round"><path d="M12 20V10"/><path d="M18 20V4"/><path d="M6 20v-4"/></svg>Featured on Visalytica</a>