
Commit Graph for Azure Repos
A GitHub/GitLab-style contribution heatmap for Azure Repos
About Commit Graph for Azure Repos
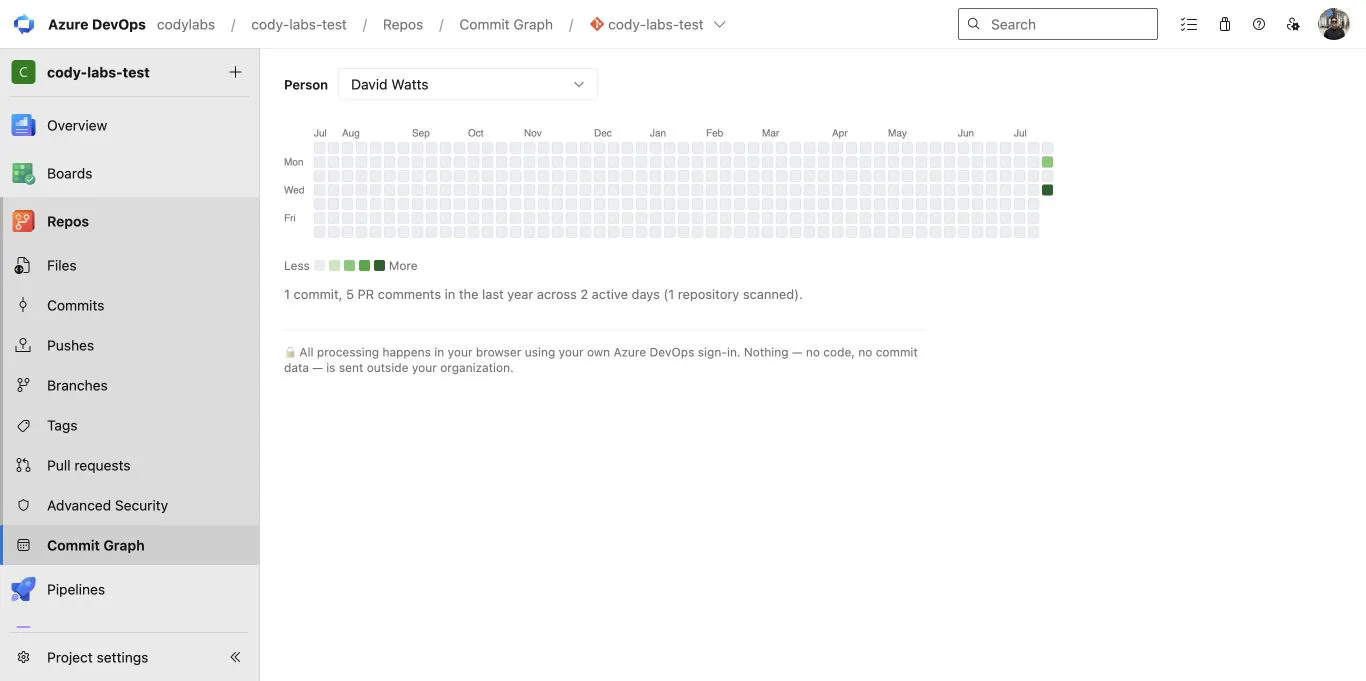
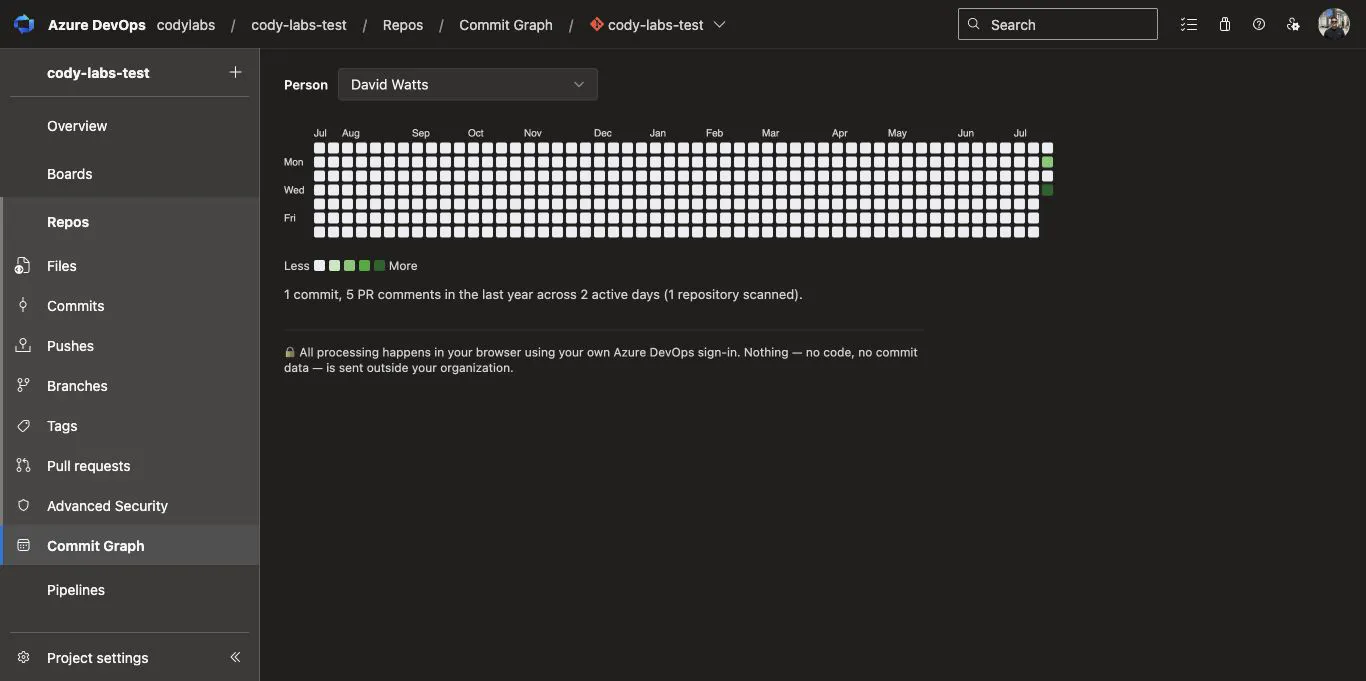
Commit Graph for Azure Repos introduces a GitHub/GitLab-style contribution heatmap directly within Azure DevOps. Designed for teams and individual developers, it visualizes commit activity and pull request comments across all repositories and contributors, providing valuable insights into project engagement over time. Unlike native Azure Repos, which lacks a visual contribution graph, this extension offers a clear, calendar-based heatmap that helps users understand individual and team activity patterns at a glance. Its client-side implementation ensures data privacy and security, running securely within the Azure DevOps web UI without any backend data transmission. The tool is accessible in a free tier, offering personal contribution graphs forever, with a paid subscription ($19/month) unlocking organization-wide contributor data, ideal for managers and open-source teams seeking comprehensive analytics. Overall, it's a powerful, privacy-conscious addition for enhancing project visibility and team performance analysis within Azure Repos.
Screenshots
Pros
- ✓Adds a GitHub-style contribution heatmap directly inside Azure DevOps
- ✓Client-side operation ensures data privacy and security
- ✓Free tier available for personal contribution tracking
- ✓Easy to use with real-time visual insights across all repositories
- ✓Affordable paid plan for organization-wide analytics
Cons
- ✗Limited to users with Azure DevOps accounts; not a standalone platform
- ✗Paid tier required for organization-wide contributor data
- ✗Features may lack advanced analytics or customization options found in dedicated analytics tools
Use Cases
Pricing
Operates on a freemium model, offering a free personal contribution graph and a paid plan ($19/month) that provides broader organizational insights. Subscription can be canceled at any time.
Quick Info
Topics
Makers

David Watts
Alternatives
Similar Tools in Developer Tools




Embed Badge
Add this badge to your website to show that Commit Graph for Azure Repos is featured on Visalytica.
<a href="https://www.visalytica.com/tool/commit-graph-for-azure-repos" target="_blank" rel="noopener noreferrer" style="display:inline-flex;align-items:center;gap:6px;padding:6px 14px;background:#7c3aed;color:#fff;border-radius:8px;font-family:-apple-system,system-ui,sans-serif;font-size:13px;font-weight:600;text-decoration:none;transition:background .2s" onmouseover="this.style.background='#6d28d9'" onmouseout="this.style.background='#7c3aed'"><svg width="14" height="14" viewBox="0 0 24 24" fill="none" stroke="currentColor" stroke-width="2.5" stroke-linecap="round" stroke-linejoin="round"><path d="M12 20V10"/><path d="M18 20V4"/><path d="M6 20v-4"/></svg>Featured on Visalytica</a>