
Claude Dashboards & Motion
Ask Claude for live dashboards and animated explainers
About Claude Dashboards & Motion
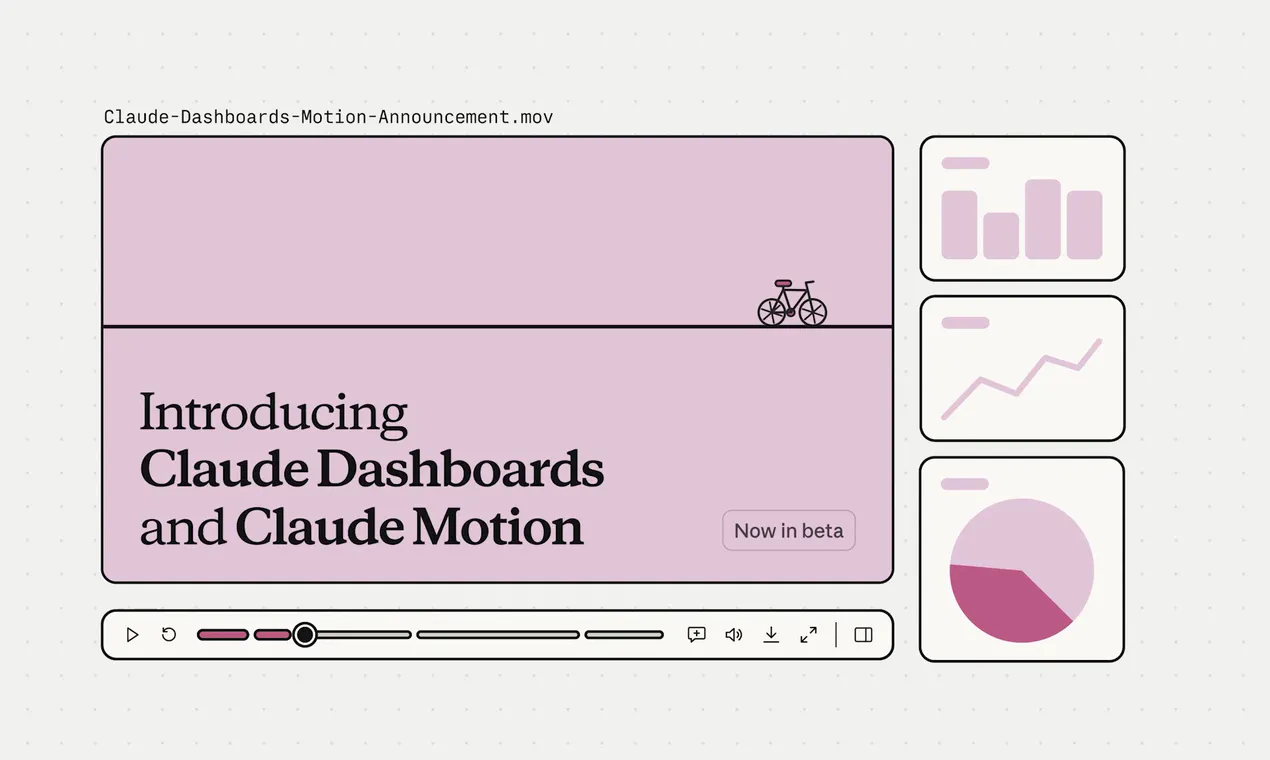
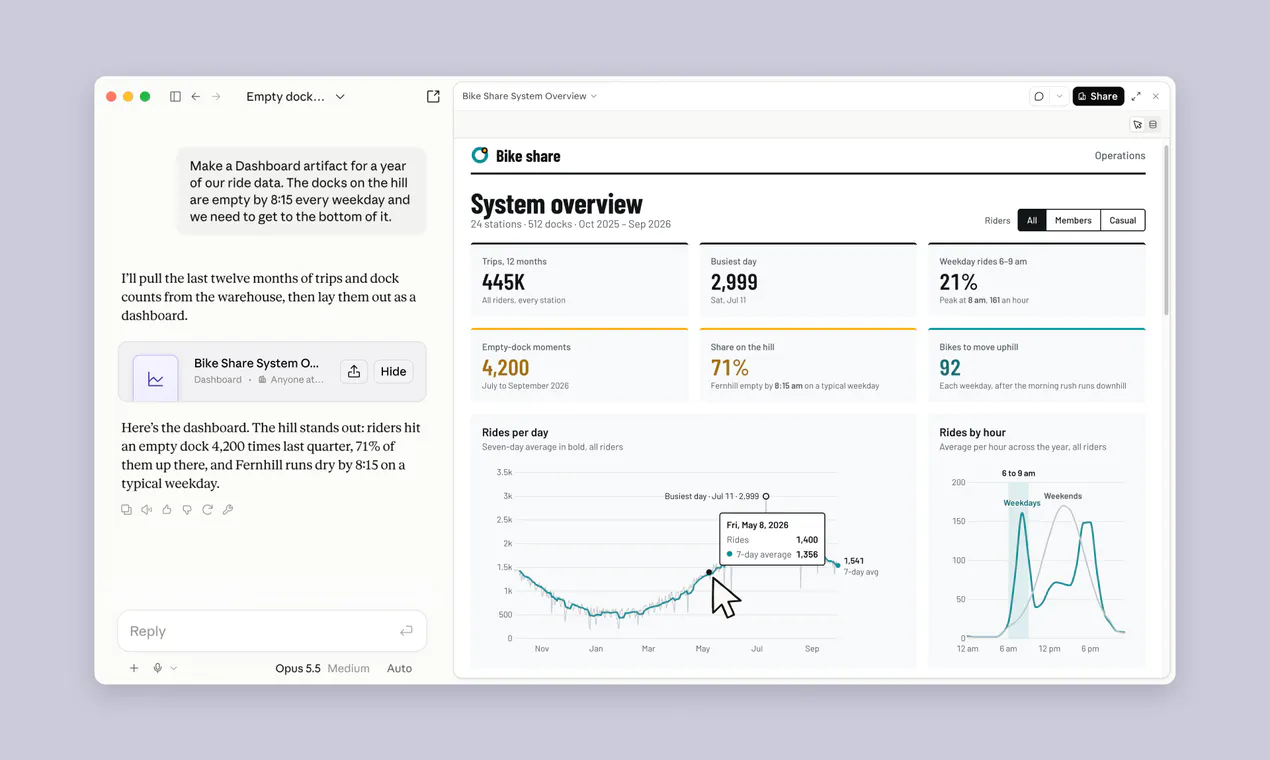
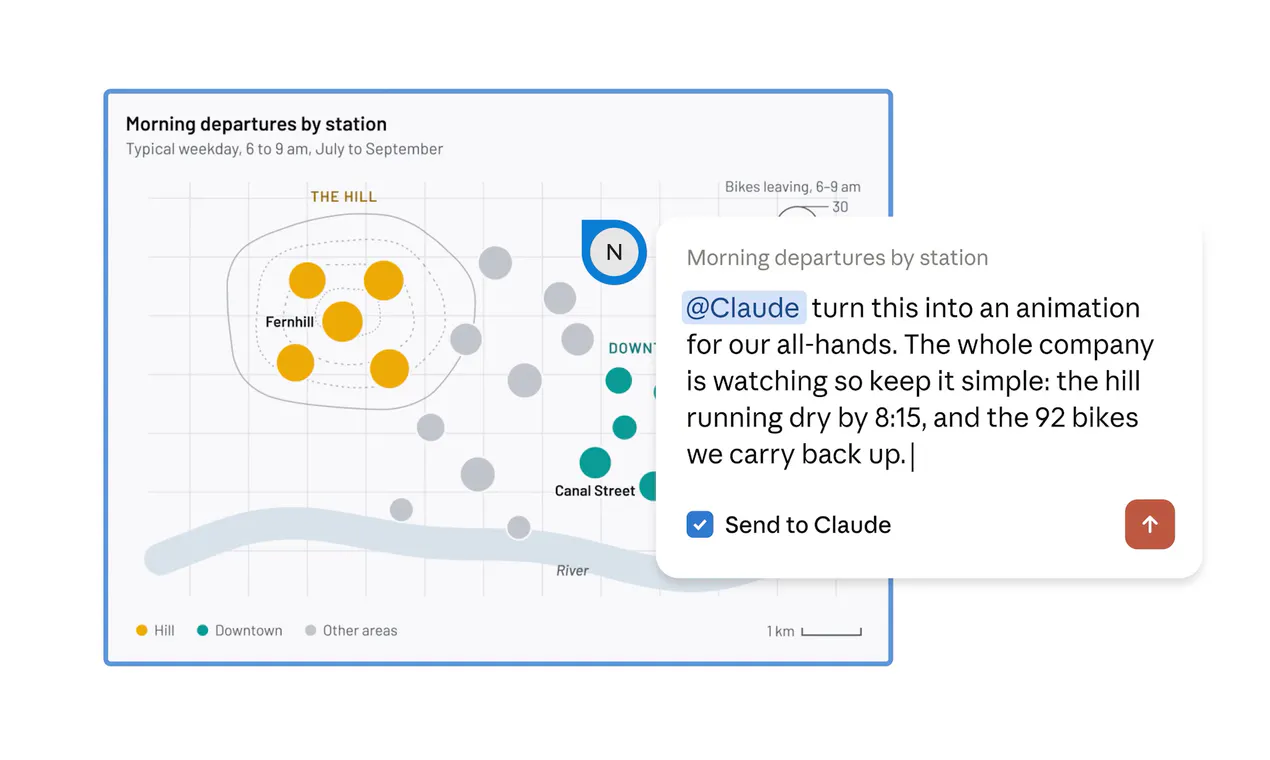
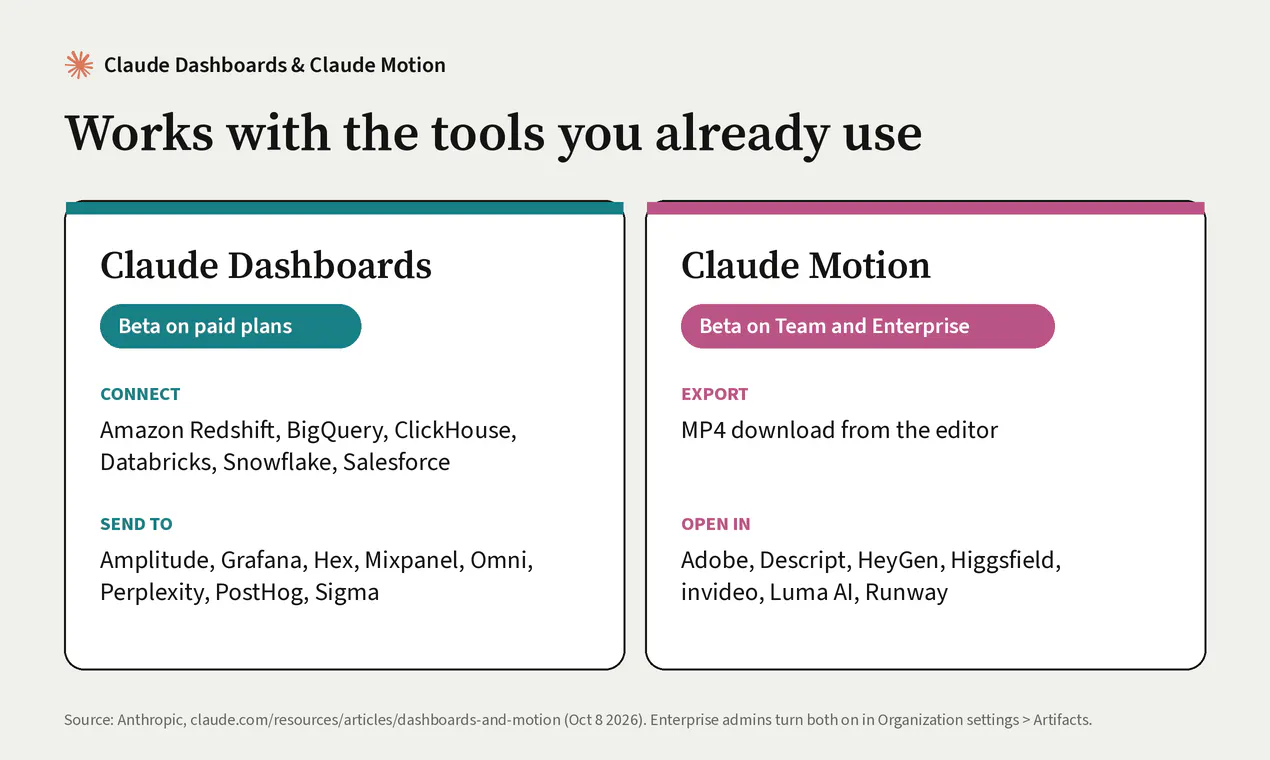
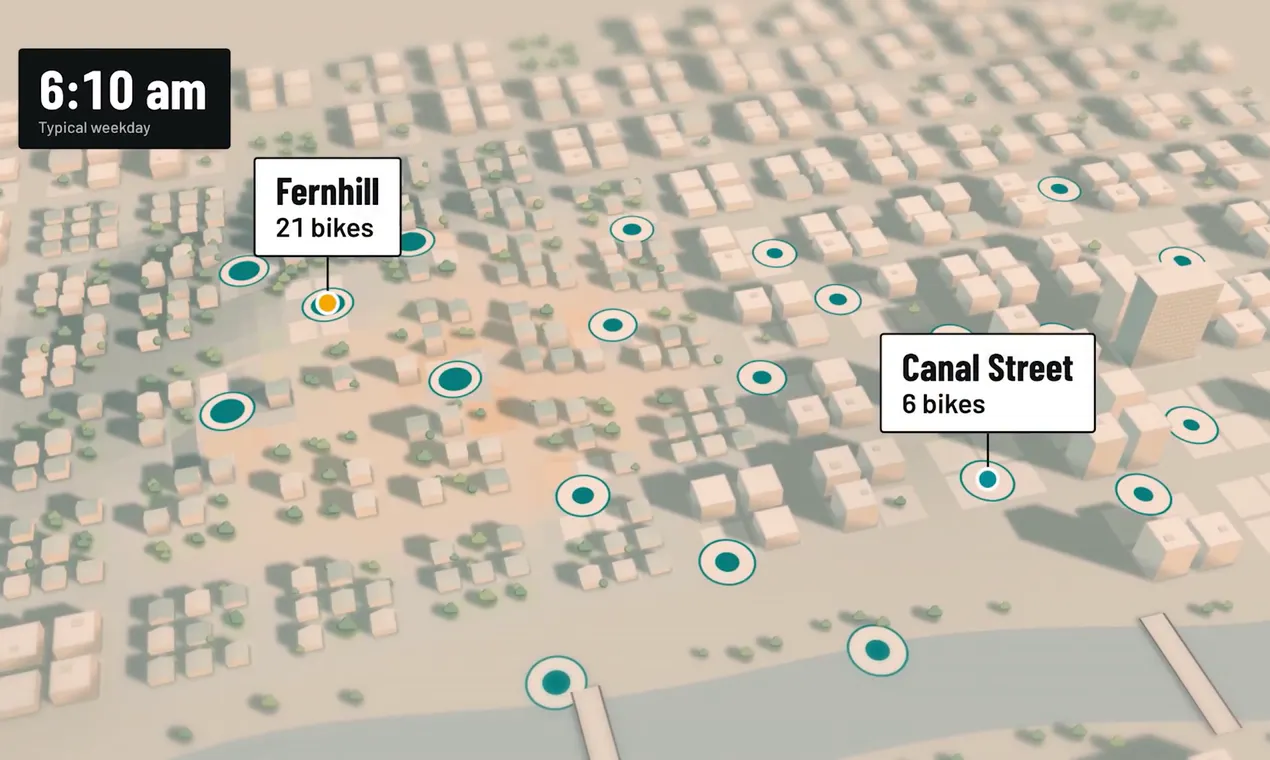
Claude Dashboards & Motion are innovative beta tools within the Claude ecosystem, designed to enhance data visualization and storytelling through AI. Dashboards allows users to connect seamlessly to popular data sources like BigQuery, Snowflake, Redshift, and Salesforce, enabling the creation of live, automatically updating dashboards from simple natural language questions. This makes data exploration accessible and dynamic, empowering teams to monitor KPIs and metrics effortlessly. Meanwhile, Claude Motion transforms static reports, charts, and walkthroughs into engaging animated videos, which can be customized by editing words, numbers, or timing before exporting as MP4 files. These features are particularly valuable for data teams, marketers, and educators seeking to communicate insights visually and interactively. With its unique integration of AI-driven automation and visualization, Claude Dashboards & Motion offers a compelling solution for real-time data storytelling and animated presentations, especially suited for collaborative team environments on paid plans.
Screenshots
Pros
- ✓Seamless integration with major data platforms like BigQuery, Snowflake, and Salesforce
- ✓Natural language interface simplifies dashboard creation and data querying
- ✓Real-time, auto-refreshing dashboards ensure up-to-date insights
- ✓Ability to create customizable animated explainers for storytelling
- ✓Suitable for collaborative teams with tiered access (Motion on Team and Enterprise)
Cons
- ✗Currently in beta, which may mean limited stability or features
- ✗Motion feature available only on paid team and enterprise plans
- ✗Limited public user feedback or reviews at this stage
Use Cases
Pricing
Pricing not verified
Quick Info
Topics
Makers

Kyle Turman
@kyleturmanAlternatives
Similar Tools in Data & Analytics


Embed Badge
Add this badge to your website to show that Claude Dashboards & Motion is featured on Visalytica.
<a href="https://www.visalytica.com/tool/claude-dashboards-motion" target="_blank" rel="noopener noreferrer" style="display:inline-flex;align-items:center;gap:6px;padding:6px 14px;background:#7c3aed;color:#fff;border-radius:8px;font-family:-apple-system,system-ui,sans-serif;font-size:13px;font-weight:600;text-decoration:none;transition:background .2s" onmouseover="this.style.background='#6d28d9'" onmouseout="this.style.background='#7c3aed'"><svg width="14" height="14" viewBox="0 0 24 24" fill="none" stroke="currentColor" stroke-width="2.5" stroke-linecap="round" stroke-linejoin="round"><path d="M12 20V10"/><path d="M18 20V4"/><path d="M6 20v-4"/></svg>Featured on Visalytica</a>