
ChartGen AI
Turn data into professional charts with insights in seconds
About ChartGen AI
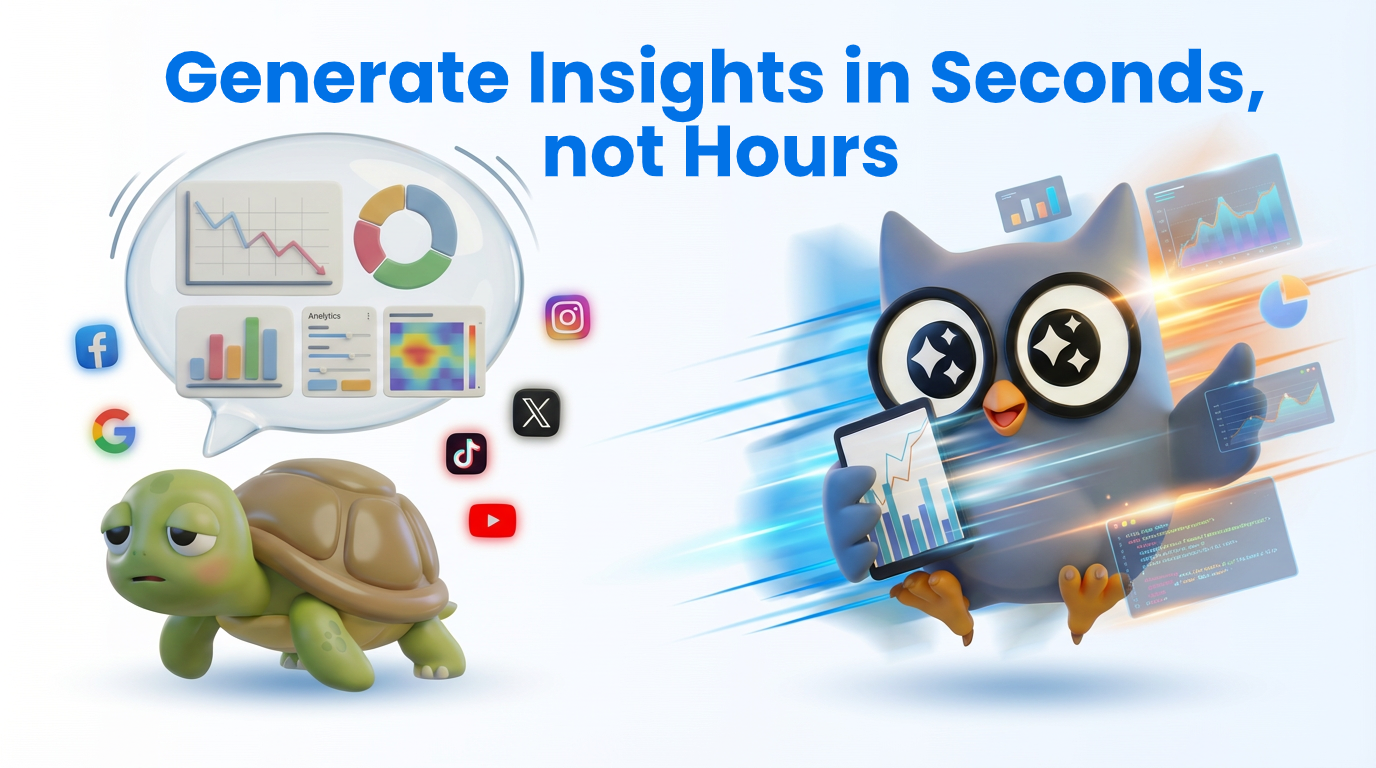
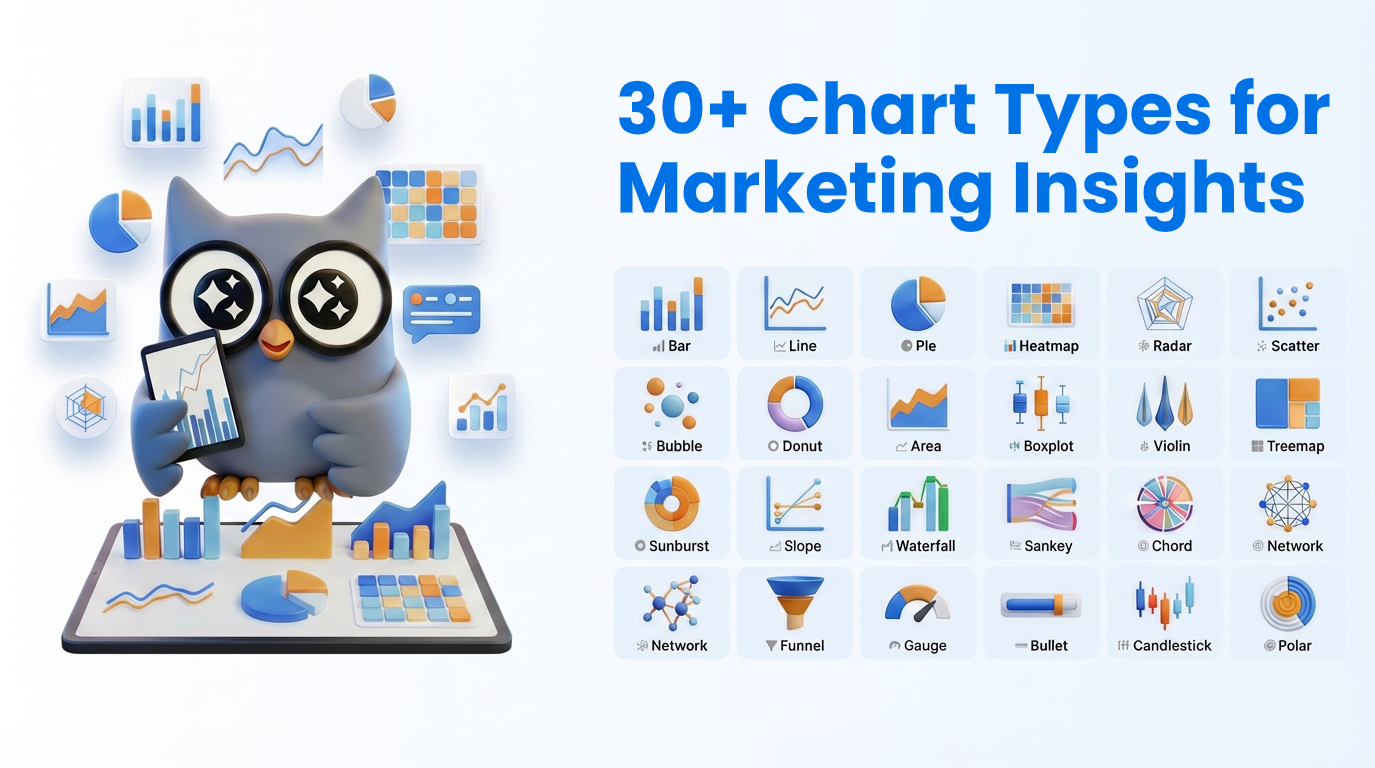
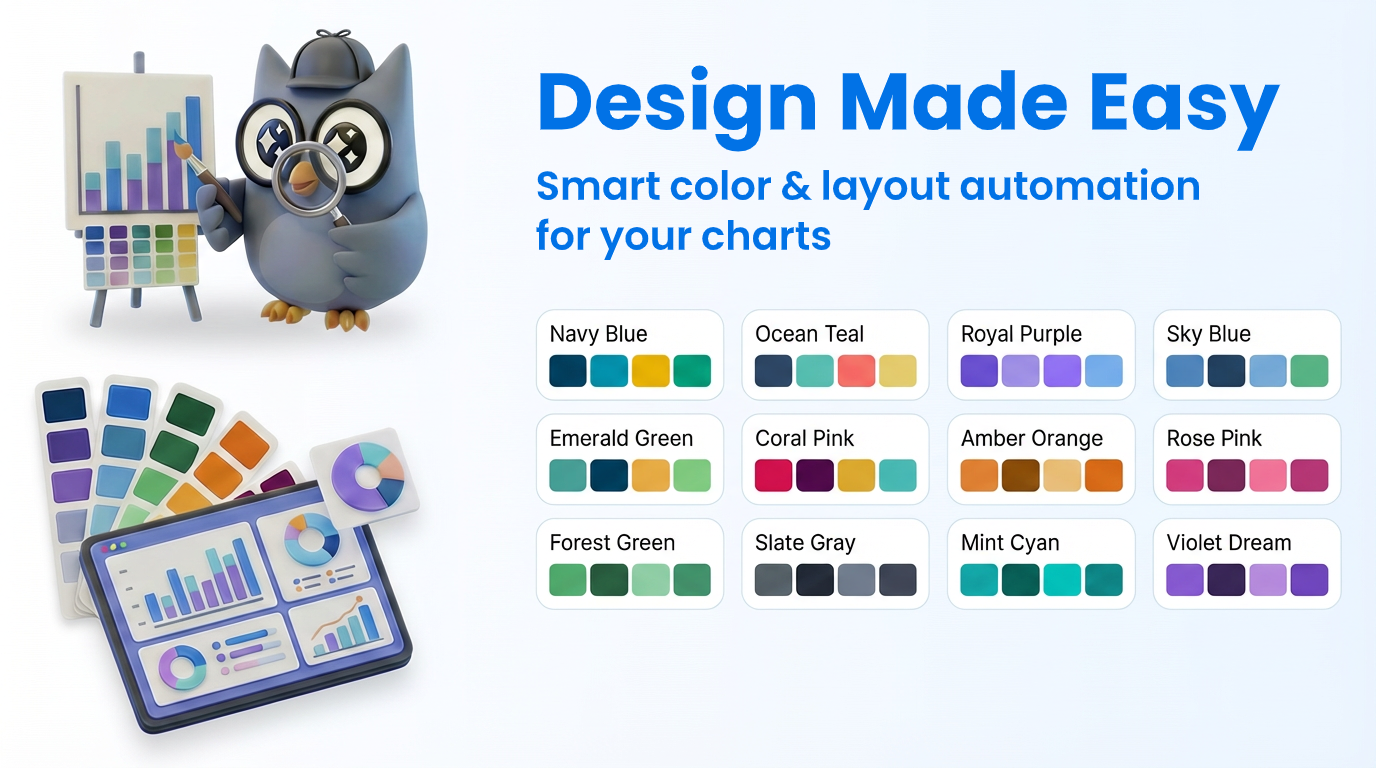
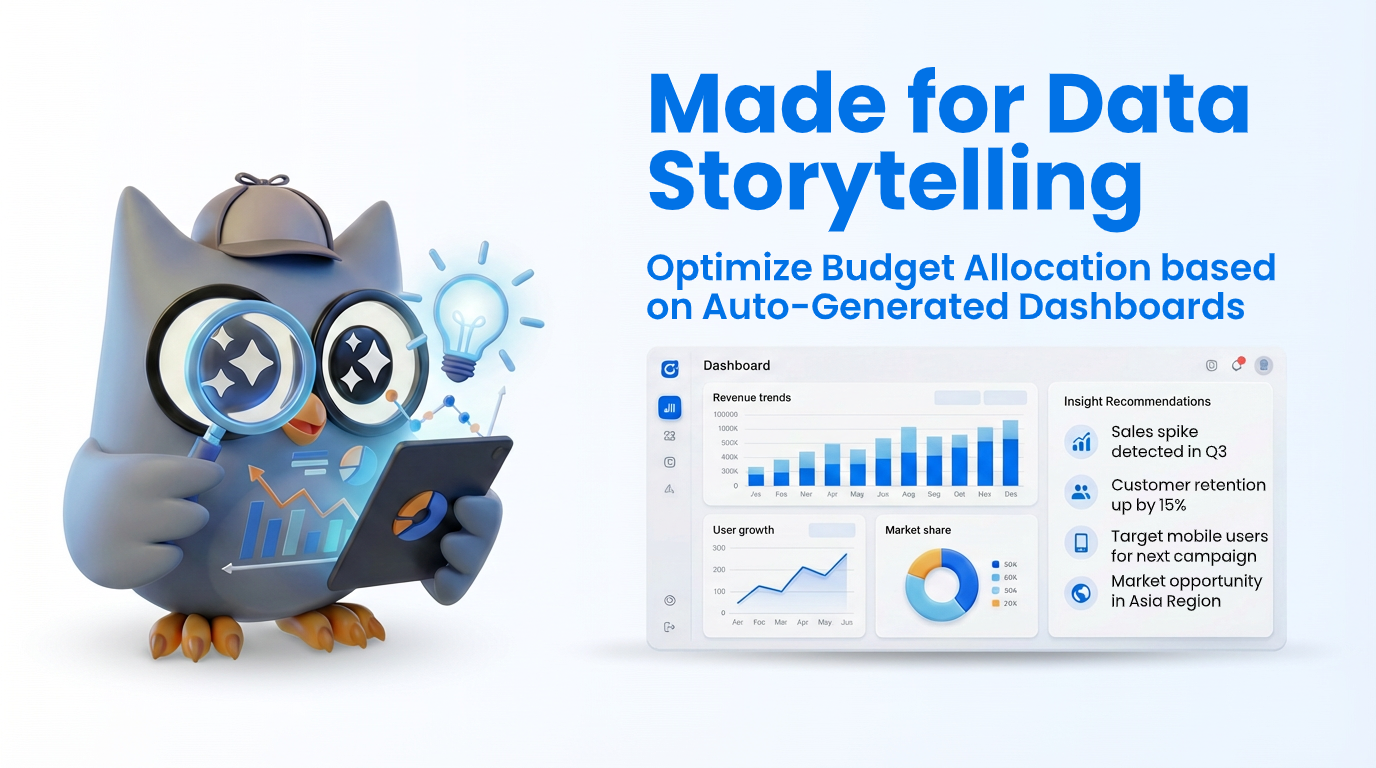
ChartGen AI is an innovative AI-powered chart generator designed specifically for online marketers and data analysts. By seamlessly connecting to various data sources such as Facebook, TikTok, and other advertising platforms, it transforms raw, unstructured data into clear, professional visualizations within seconds. This tool simplifies the process of analyzing large datasets, helping users quickly identify trends, optimize ad spend, and uncover actionable insights without the need for complex technical skills. Its automation capabilities allow marketers to focus more on strategic decision-making rather than data crunching, making it an invaluable asset for fast-paced digital marketing teams. Built by the makers of Ada.im, ChartGen AI stands out for its ease of use, speed, and the ability to generate visually compelling charts that drive smarter business decisions.
Screenshots

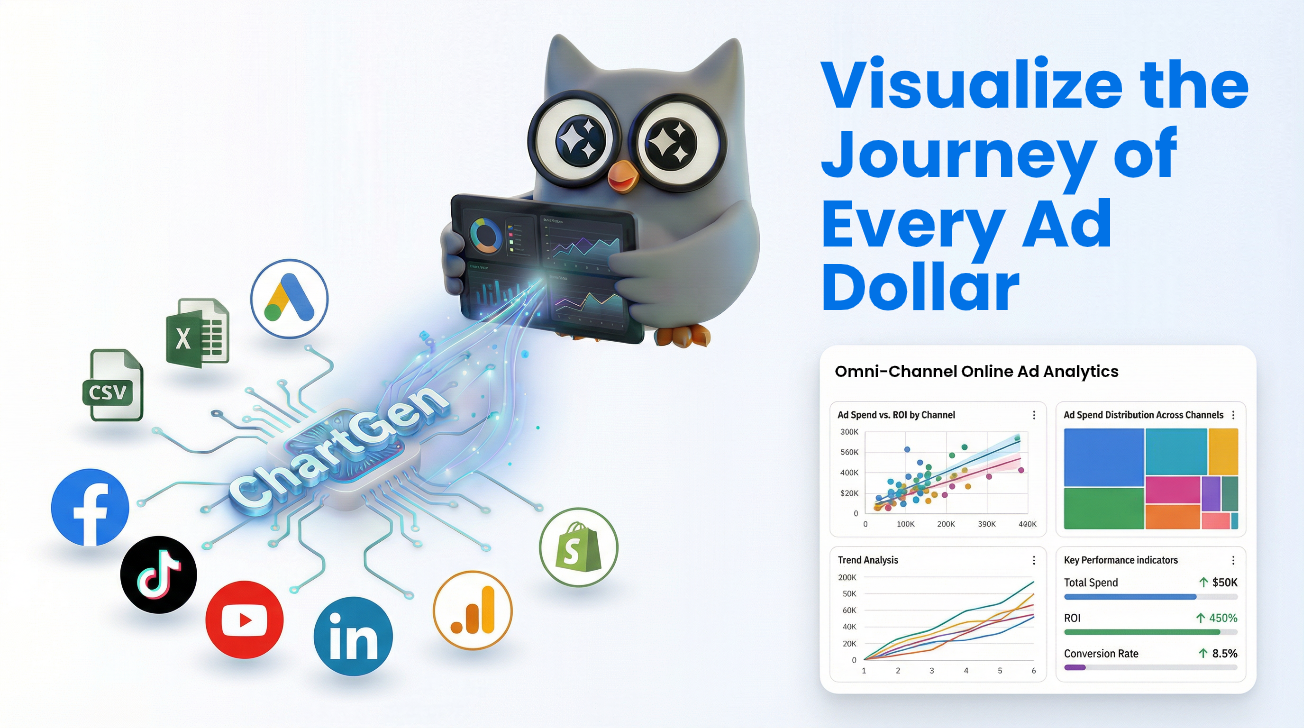
+3 more screenshots
Pros
- ✓Fast and automated data-to-chart conversion
- ✓Connects easily to multiple data sources like Facebook and TikTok
- ✓User-friendly interface suitable for non-technical users
- ✓Generates professional, insightful visualizations instantly
- ✓Helps in budget optimization and trend analysis
Cons
- ✗Limited customization options for advanced users
- ✗Dependent on data source integrations, which may require setup time
- ✗Pricing details are not explicitly provided and may vary based on data volume
Use Cases
Pricing
Likely employs a freemium model with a free tier offering basic features, and paid plans starting around $20-$50 per month for advanced integrations and higher data limits. Exact pricing details are not publicly specified.
Quick Info
Topics
Alternatives
Similar Tools in AI Image & Design
Embed Badge
Add this badge to your website to show that ChartGen AI is featured on Visalytica.
<a href="https://www.visalytica.com/tool/chartgen-ai" target="_blank" rel="noopener noreferrer" style="display:inline-flex;align-items:center;gap:6px;padding:6px 14px;background:#7c3aed;color:#fff;border-radius:8px;font-family:-apple-system,system-ui,sans-serif;font-size:13px;font-weight:600;text-decoration:none;transition:background .2s" onmouseover="this.style.background='#6d28d9'" onmouseout="this.style.background='#7c3aed'"><svg width="14" height="14" viewBox="0 0 24 24" fill="none" stroke="currentColor" stroke-width="2.5" stroke-linecap="round" stroke-linejoin="round"><path d="M12 20V10"/><path d="M18 20V4"/><path d="M6 20v-4"/></svg>Featured on Visalytica</a>