
Charted Data
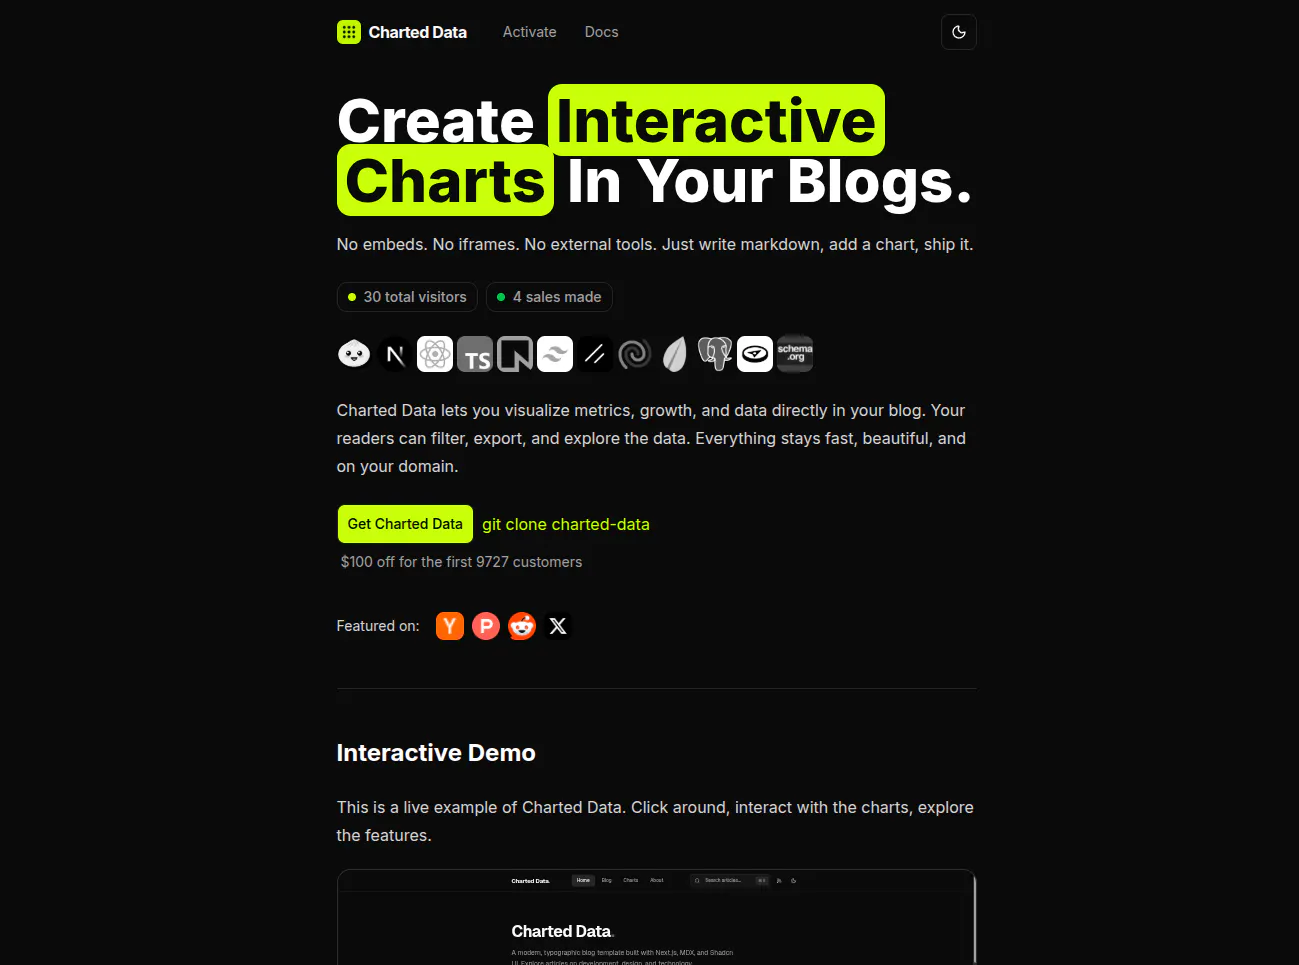
Create Interactive Charts In Your Blogs.
About Charted Data
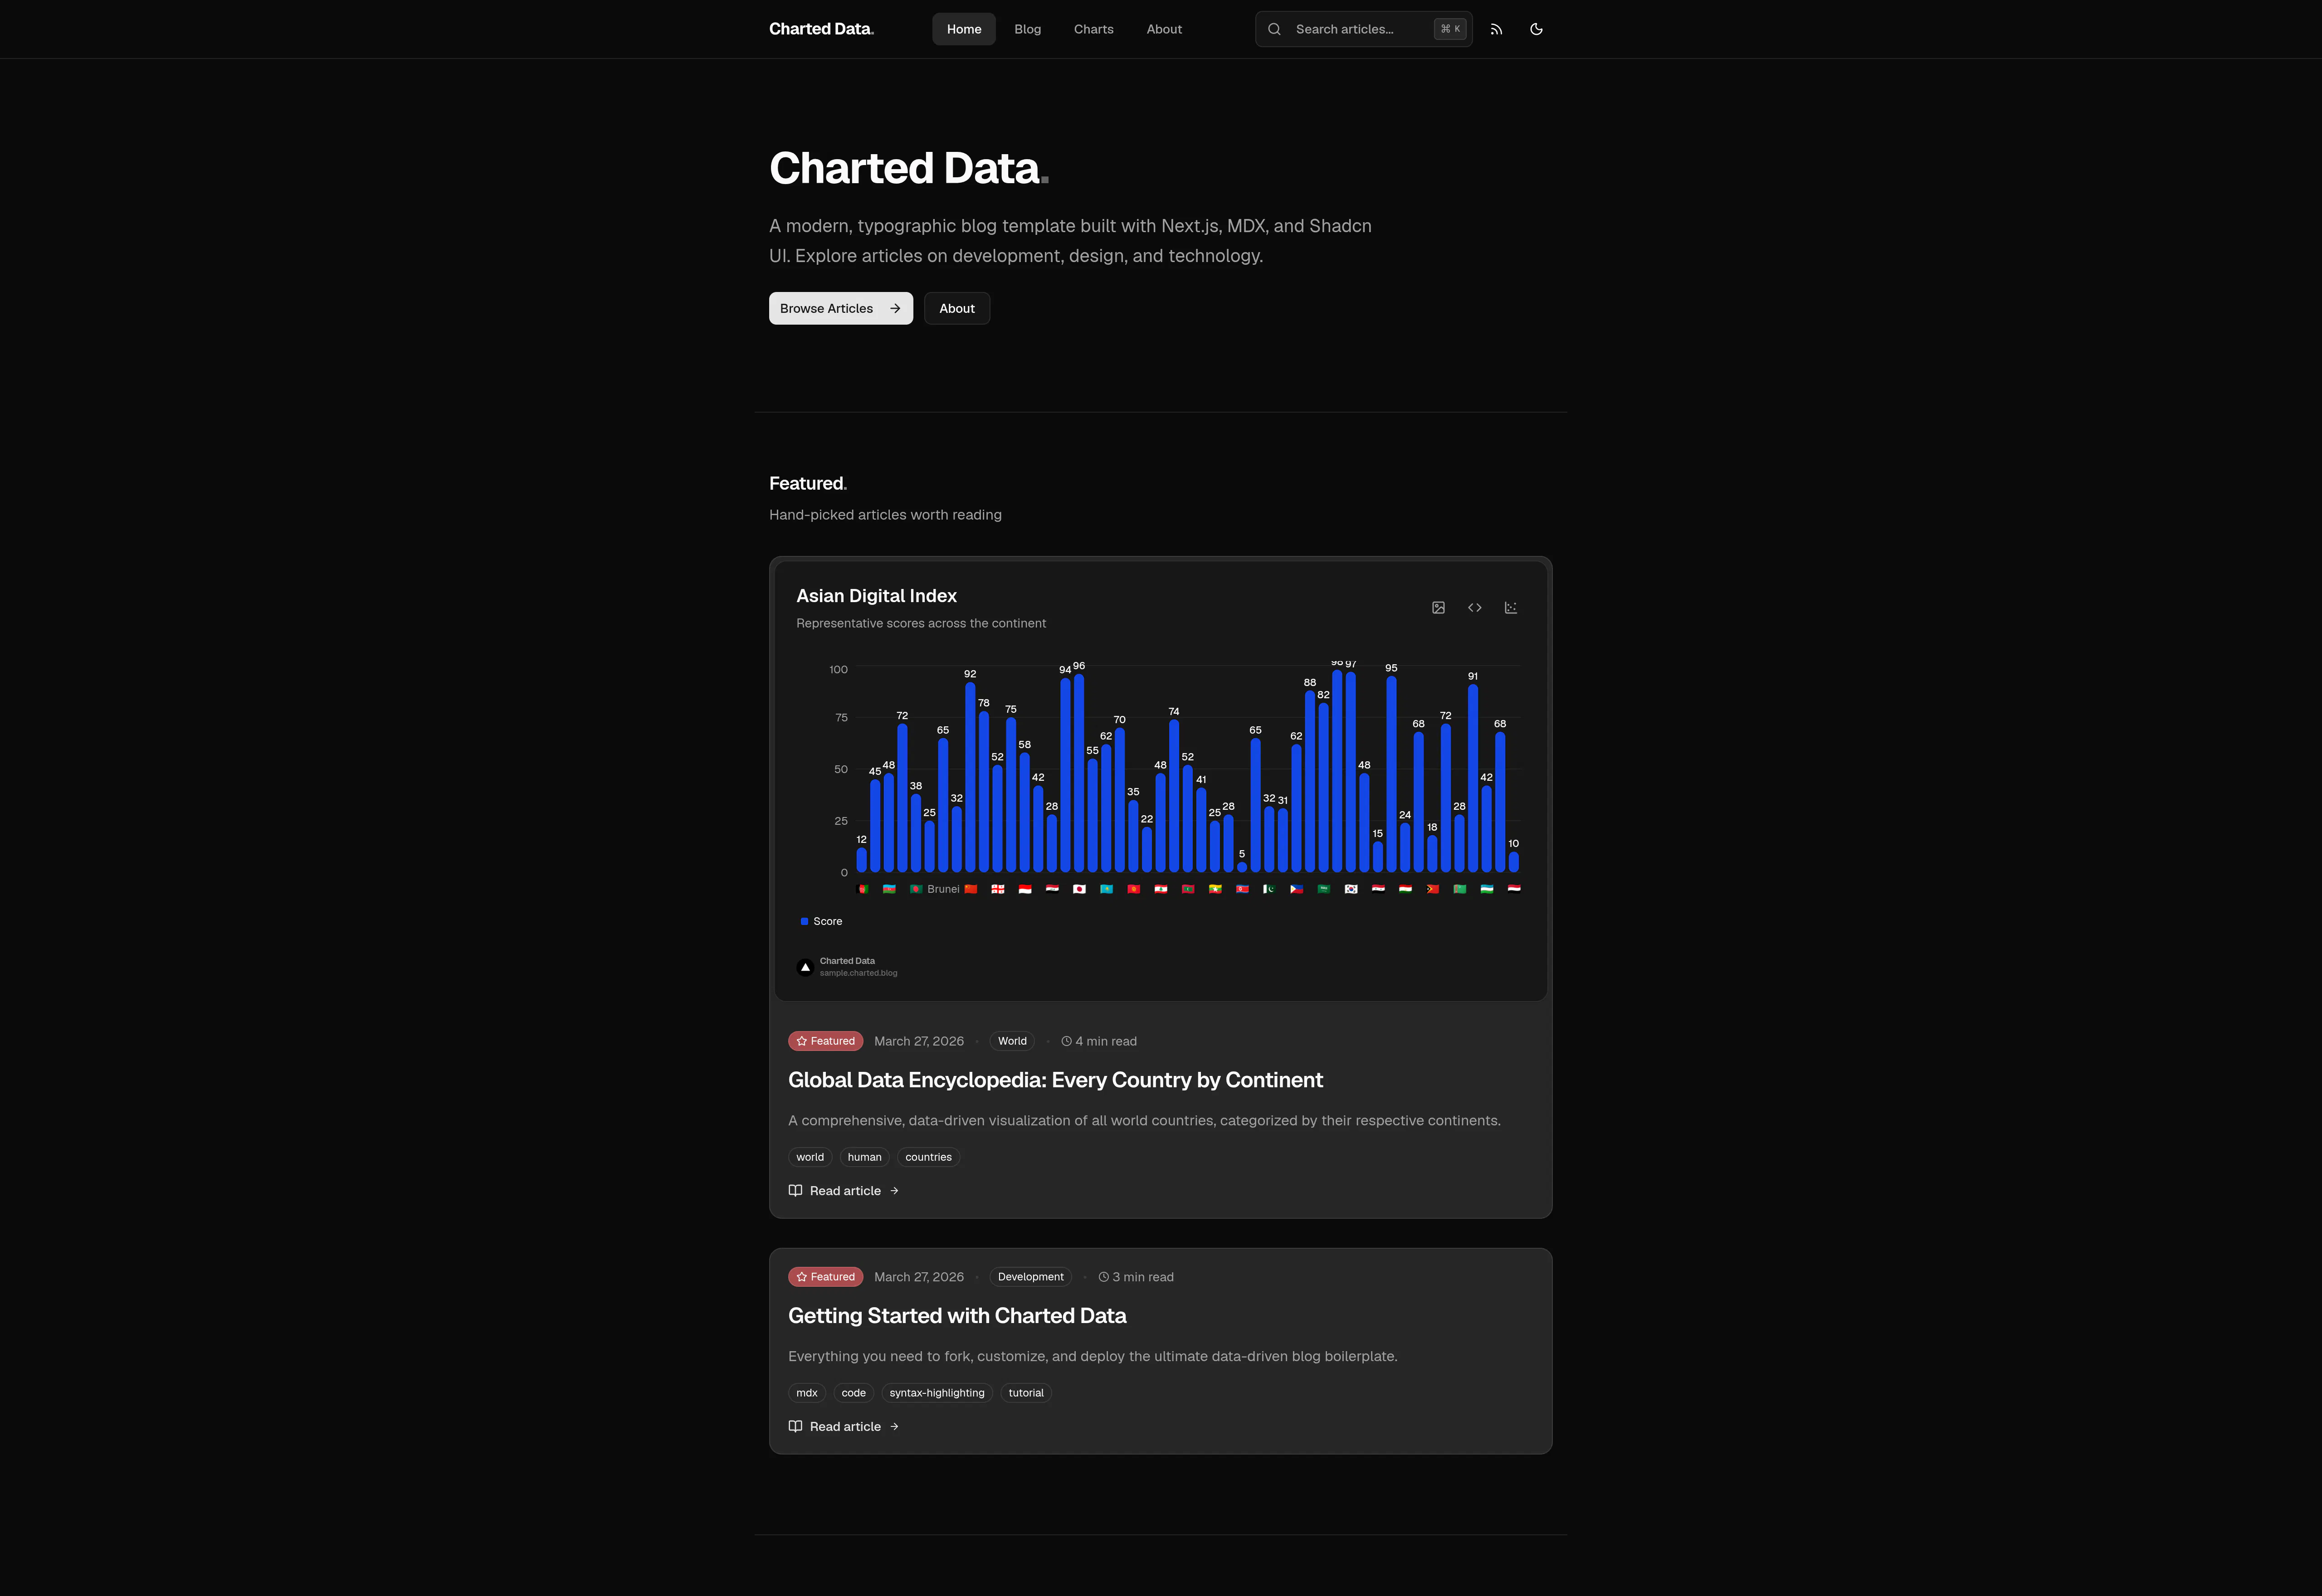
Charted Data is a innovative tool designed for bloggers, content creators, and data enthusiasts who want to embed interactive charts seamlessly into their articles. Unlike traditional methods that rely on external embeds, iframes, or complex integrations, Charted Data simplifies the process by allowing users to create and insert dynamic charts directly within their Markdown content. This makes it an ideal solution for anyone looking to enhance their blog posts with visual data representations without adding clutter or external dependencies. Its straightforward approach encourages more engaging storytelling through data, making complex information more digestible for readers. The tool stands out for its ease of use, requiring only markdown syntax and a simple chart addition, which streamlines the entire process for non-technical users and seasoned writers alike.
Screenshots
Pros
- ✓Easy to use with simple markdown integration
- ✓No need for external embeds or iframes
- ✓Creates interactive, engaging charts within blogs
- ✓Reduces reliance on third-party tools or plugins
- ✓Suitable for non-technical users and content creators
Cons
- ✗Limited information on customization options
- ✗No details on supported chart types or features
- ✗User base and community support are currently unknown
Use Cases
Pricing
Pricing not verified
Quick Info
Topics
Makers

Abubaker Siddique
Similar Tools in AI Writing




Embed Badge
Add this badge to your website to show that Charted Data is featured on Visalytica.
<a href="https://www.visalytica.com/tool/charted-data" target="_blank" rel="noopener noreferrer" style="display:inline-flex;align-items:center;gap:6px;padding:6px 14px;background:#7c3aed;color:#fff;border-radius:8px;font-family:-apple-system,system-ui,sans-serif;font-size:13px;font-weight:600;text-decoration:none;transition:background .2s" onmouseover="this.style.background='#6d28d9'" onmouseout="this.style.background='#7c3aed'"><svg width="14" height="14" viewBox="0 0 24 24" fill="none" stroke="currentColor" stroke-width="2.5" stroke-linecap="round" stroke-linejoin="round"><path d="M12 20V10"/><path d="M18 20V4"/><path d="M6 20v-4"/></svg>Featured on Visalytica</a>