
Basedash MCP write
Build charts and dashboards from Cursor and Claude
About Basedash MCP write
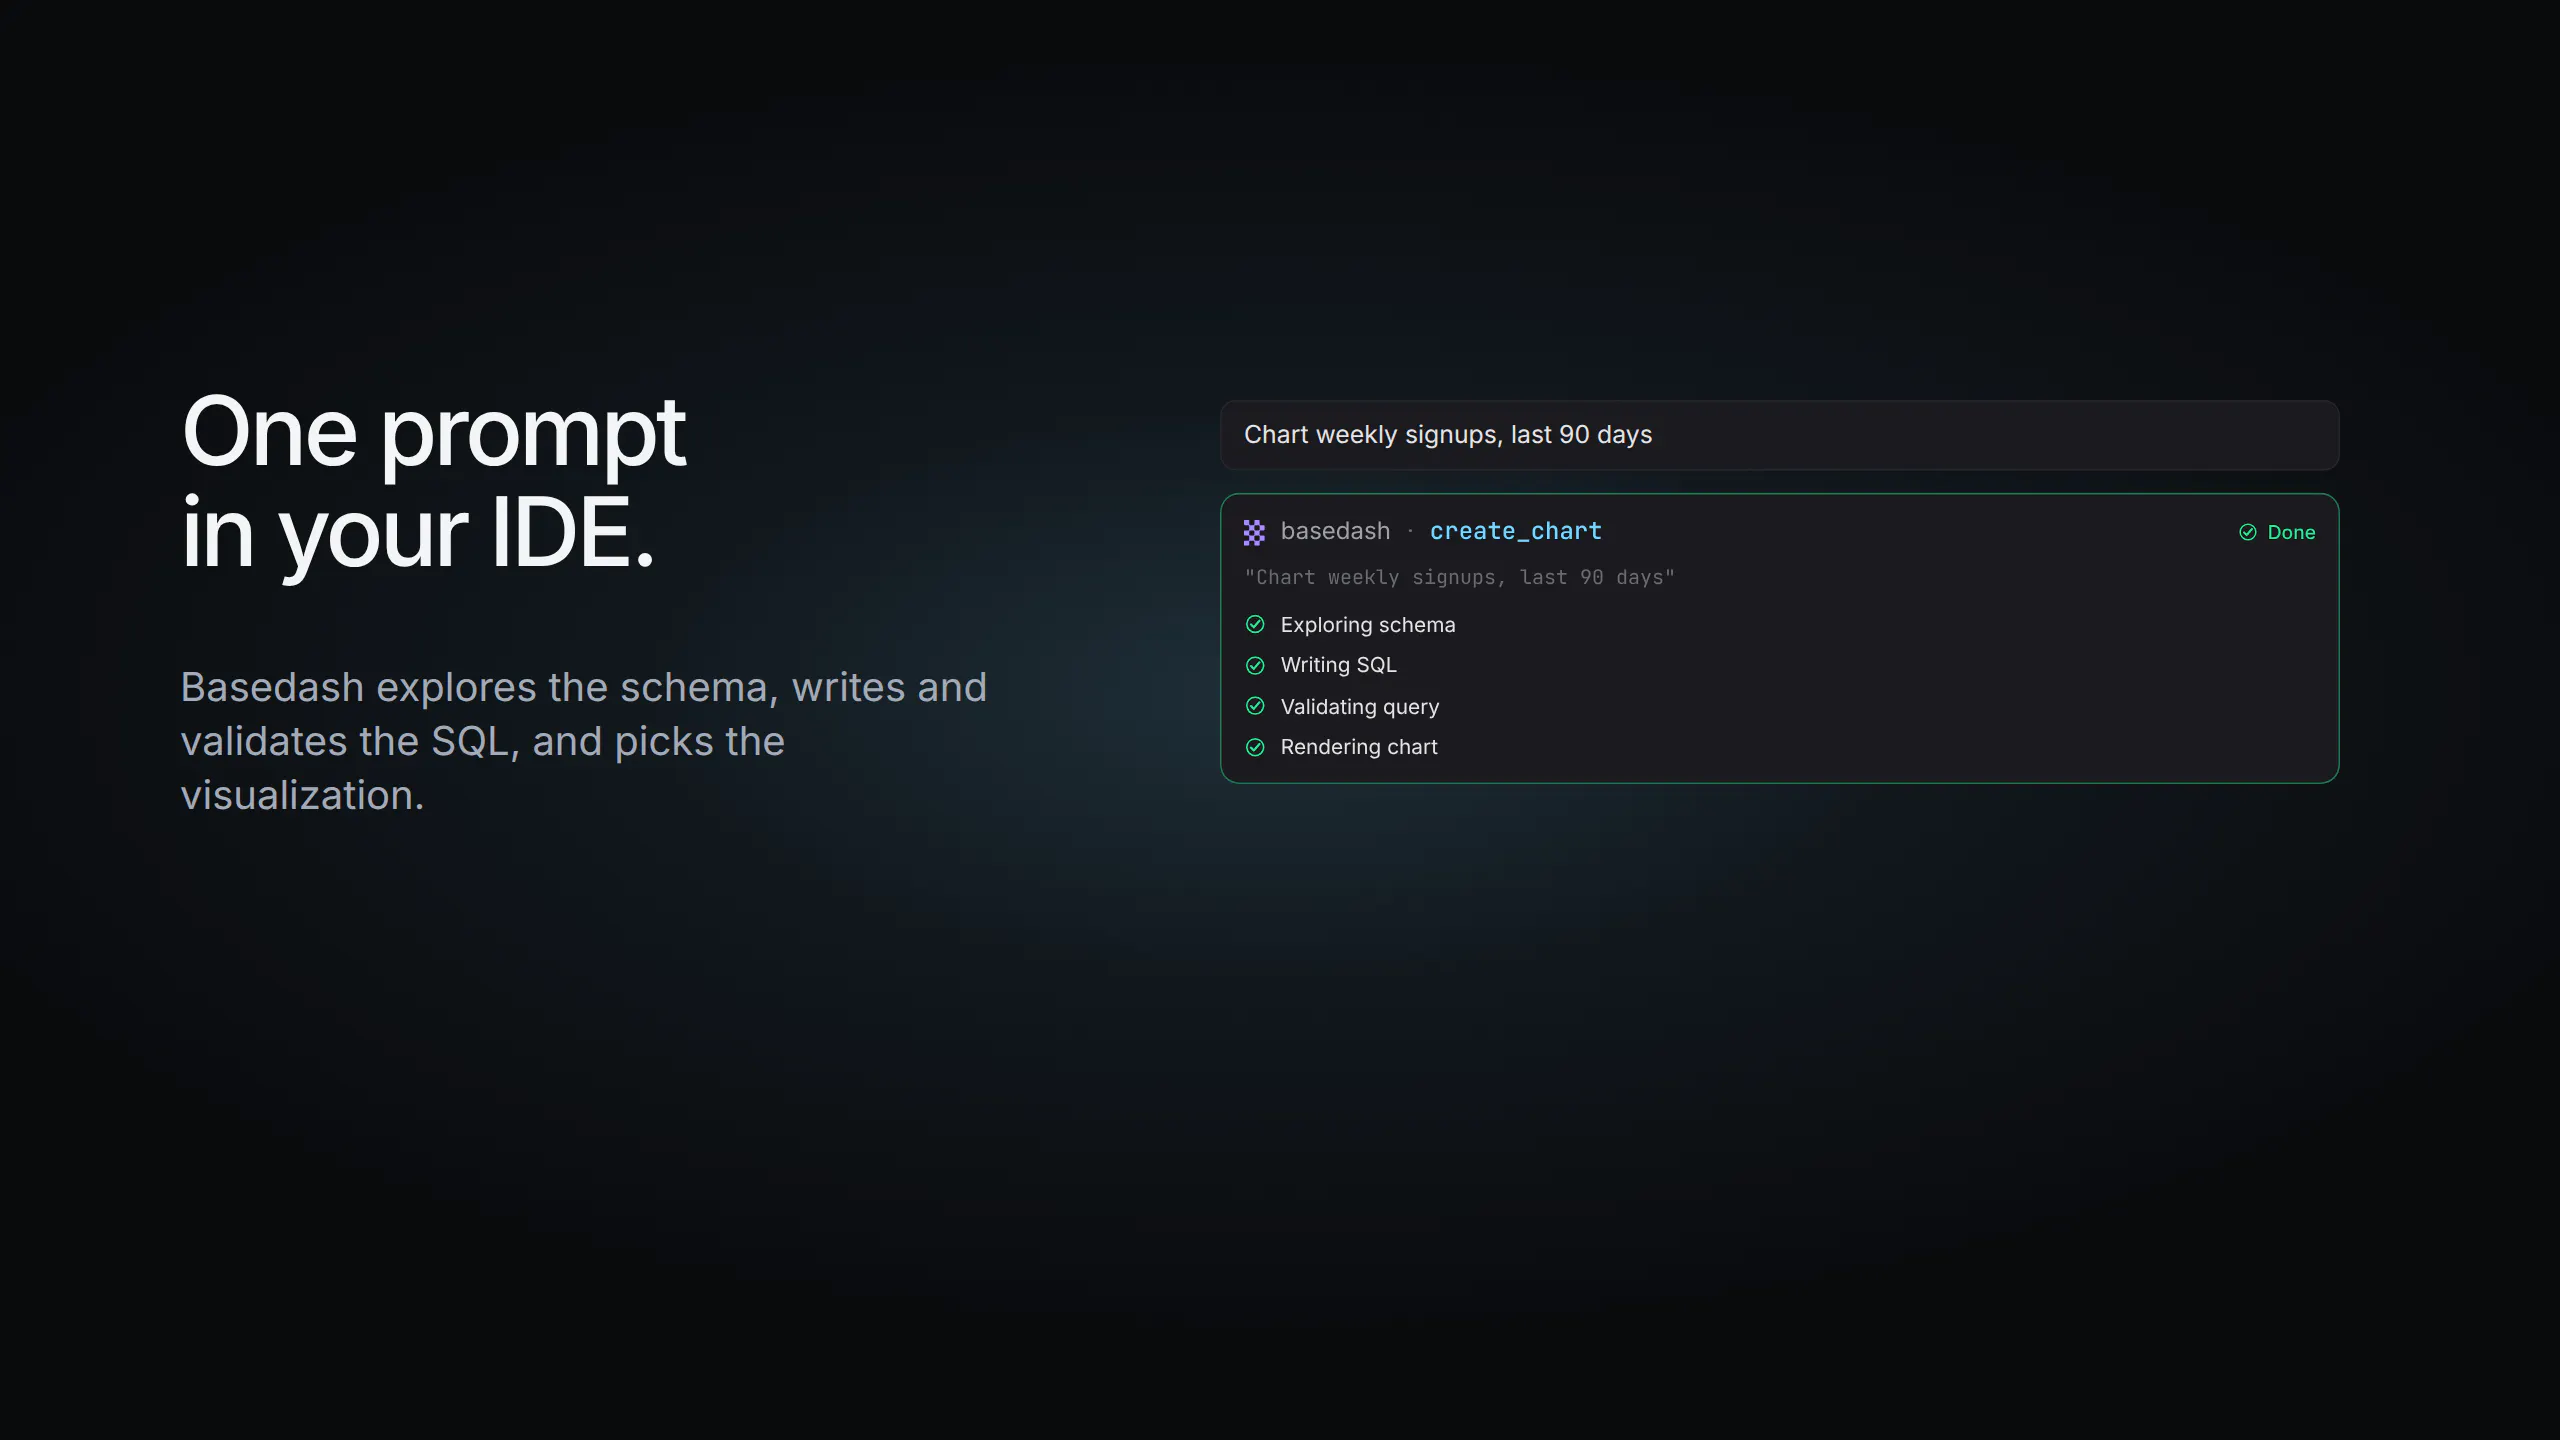
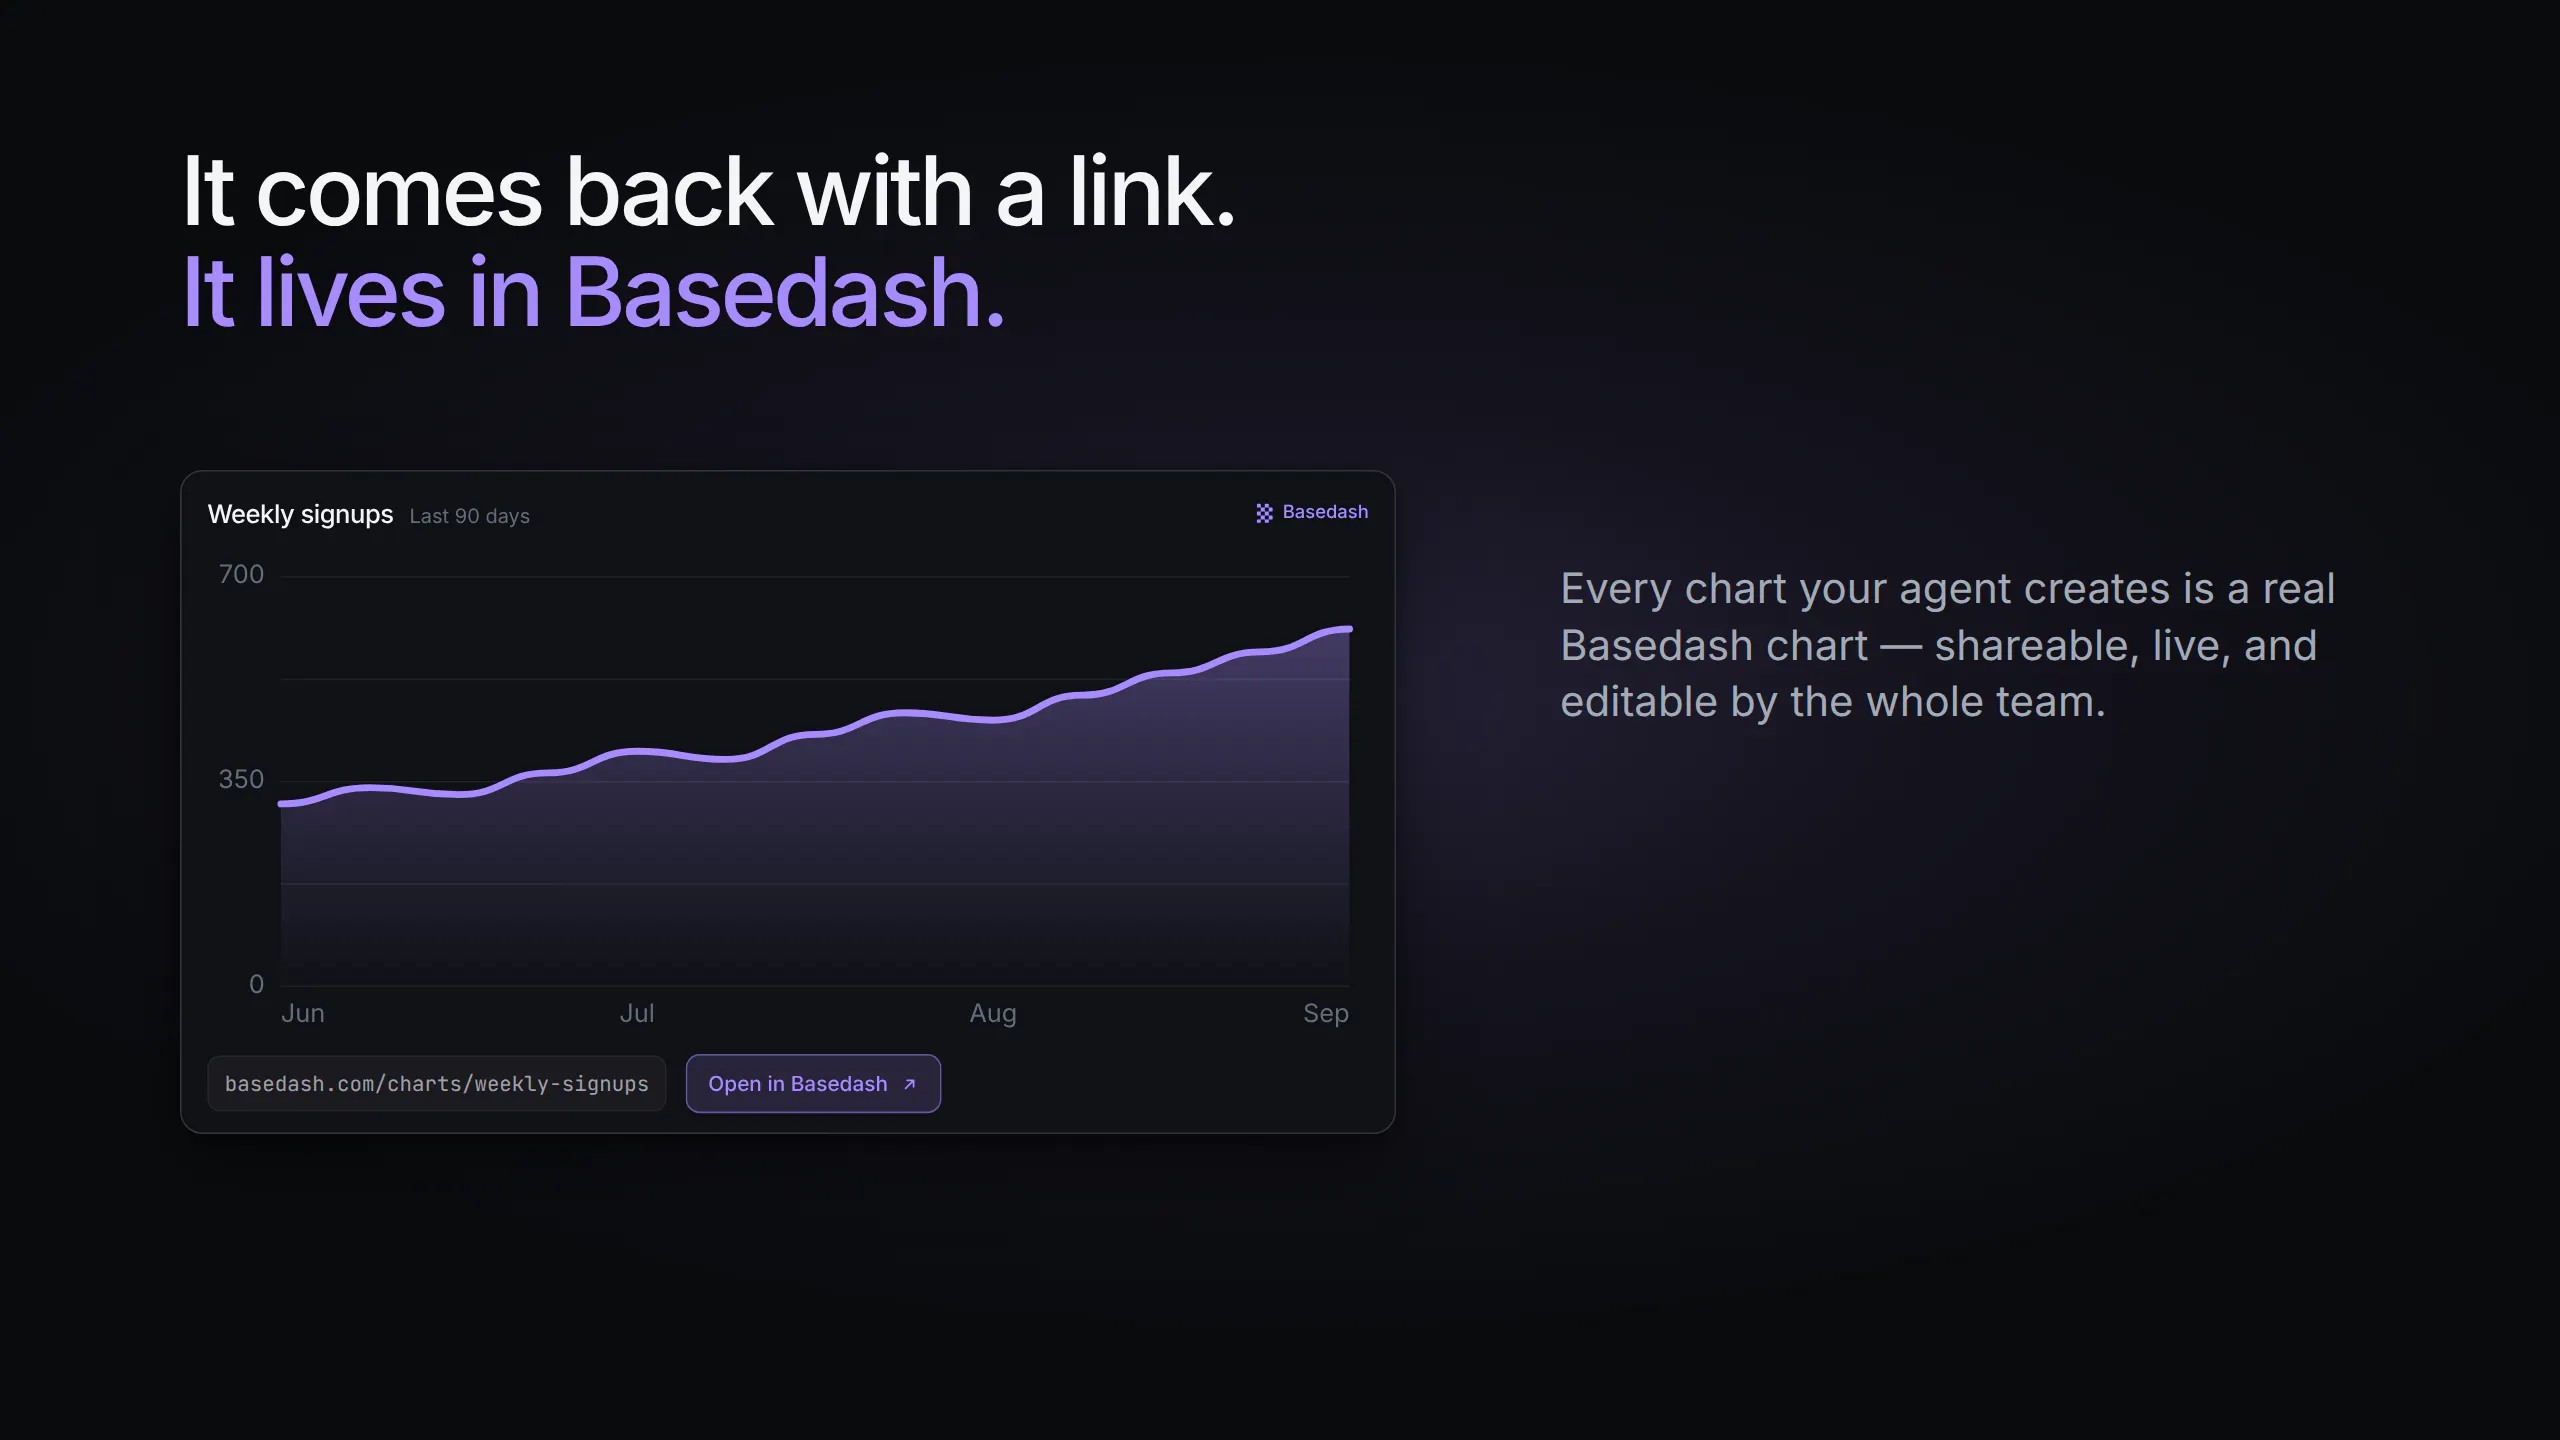
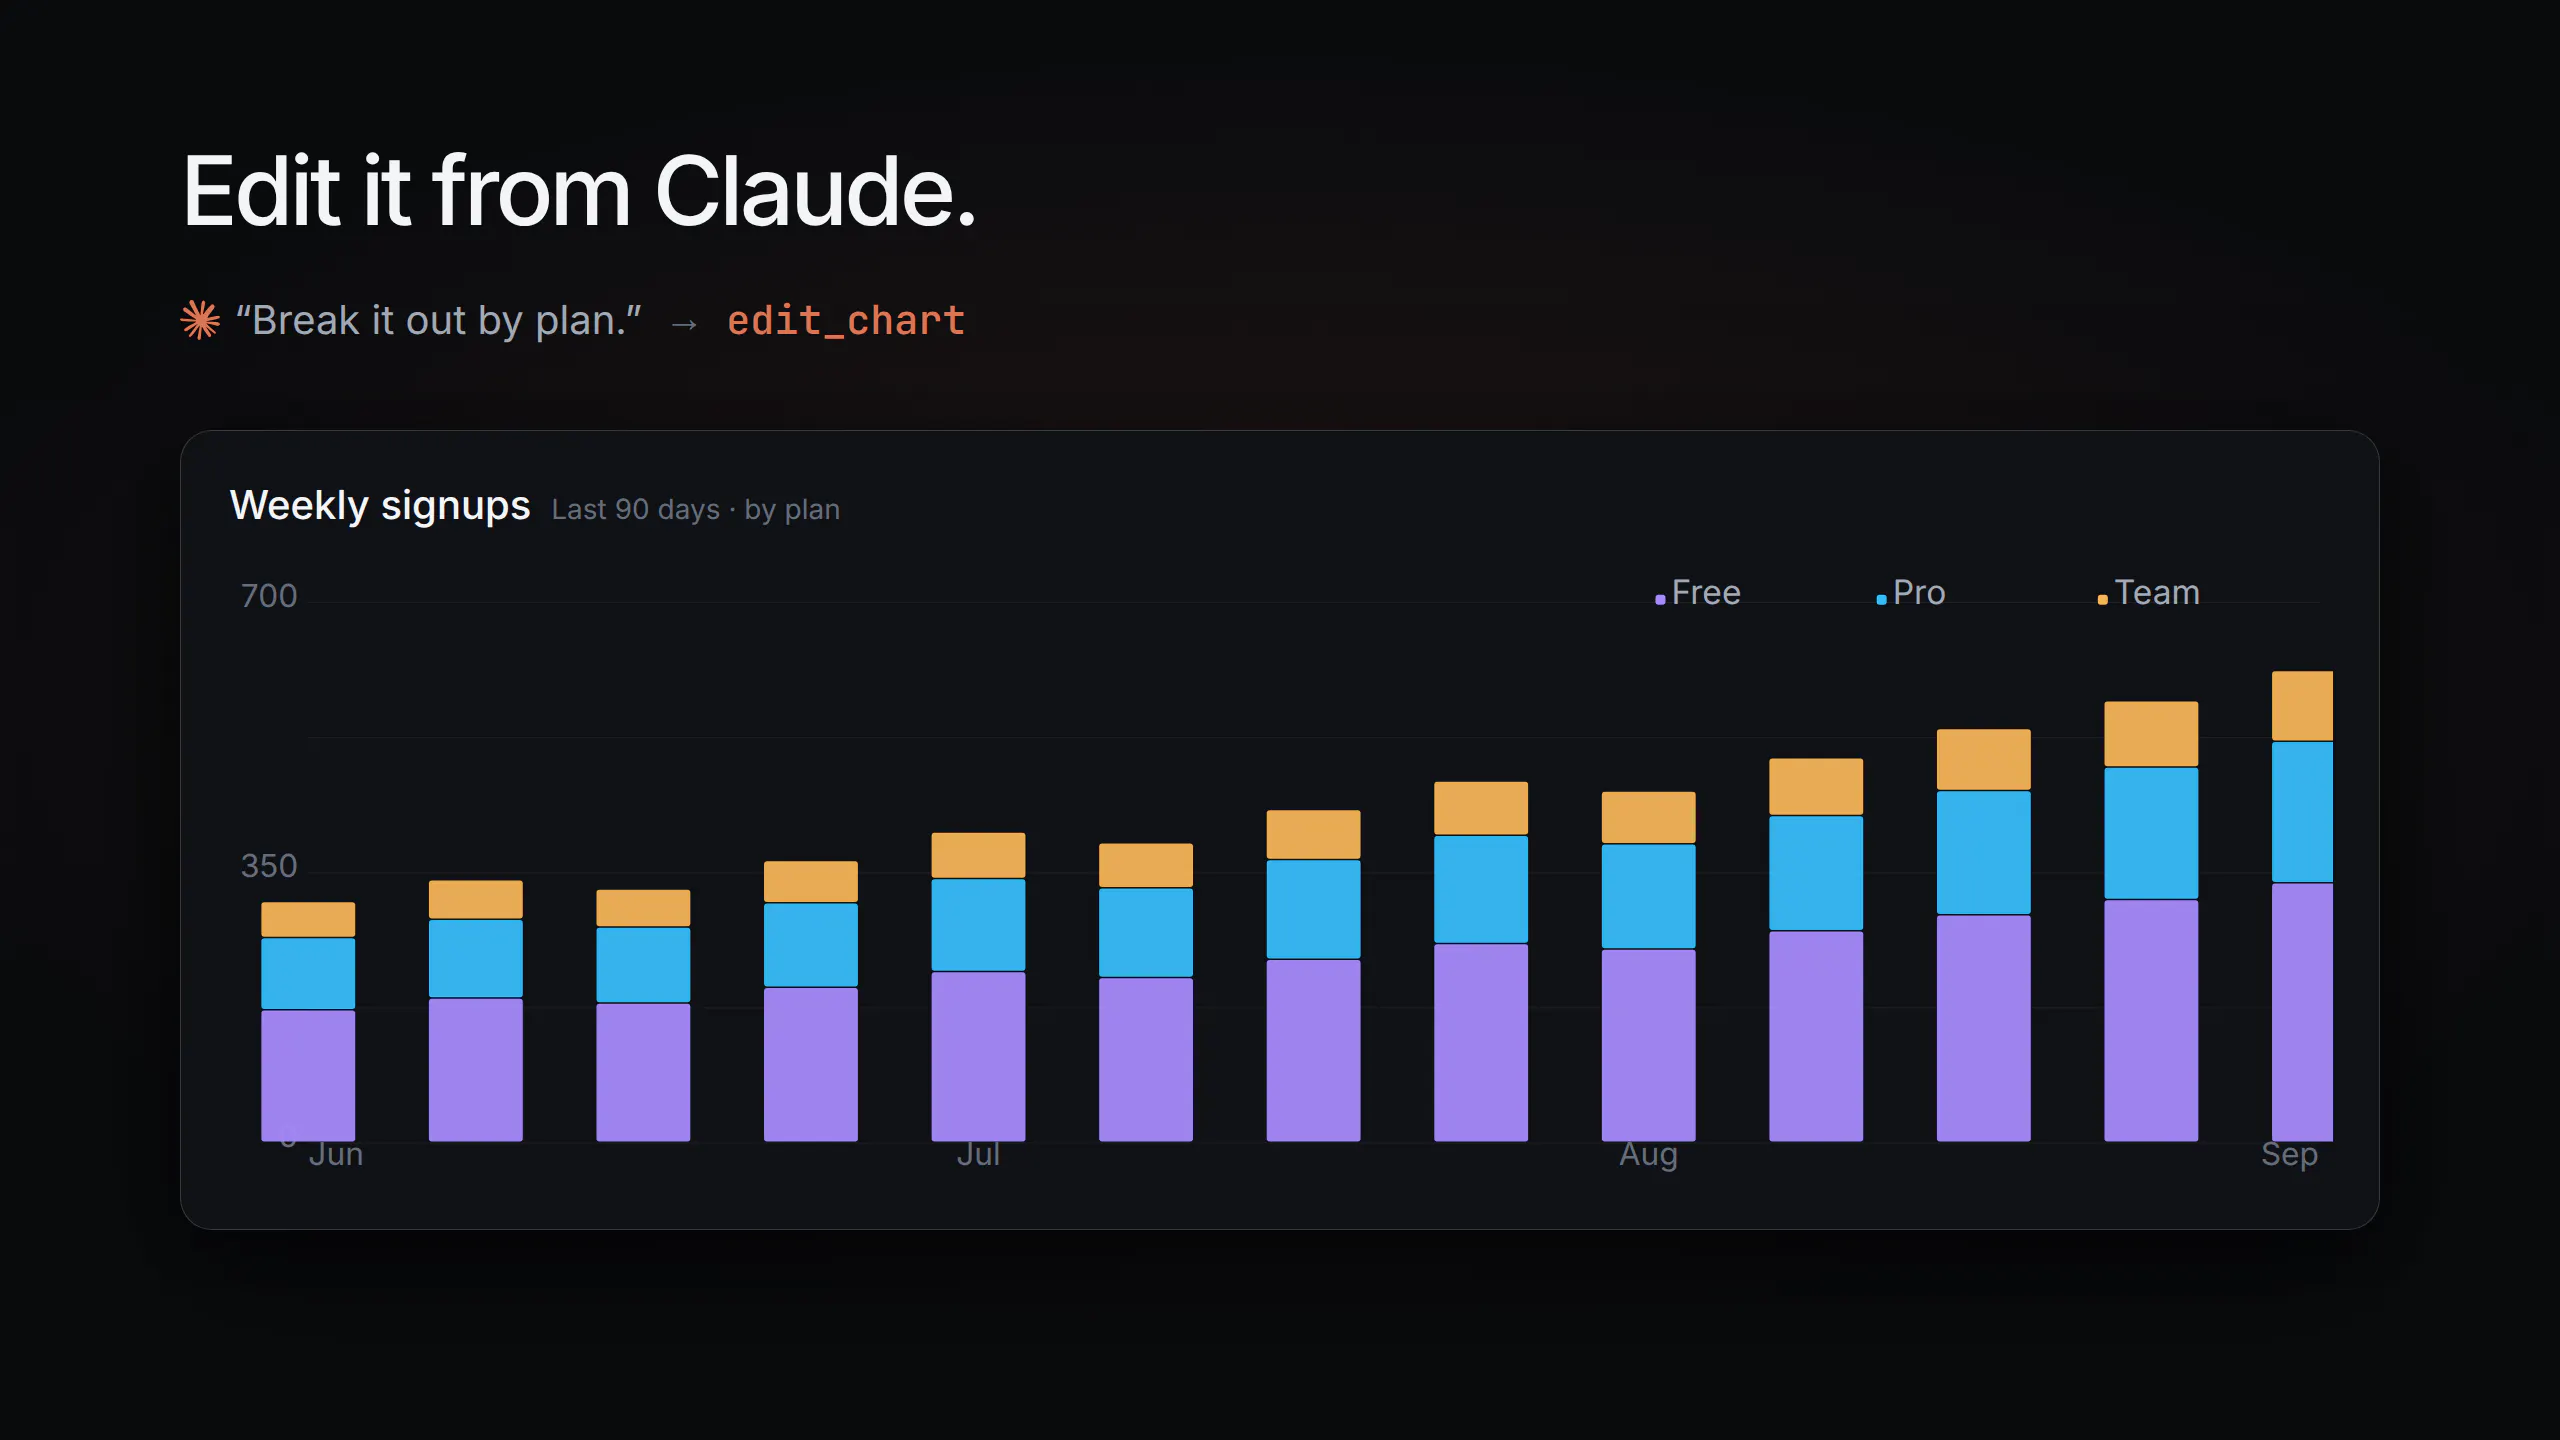
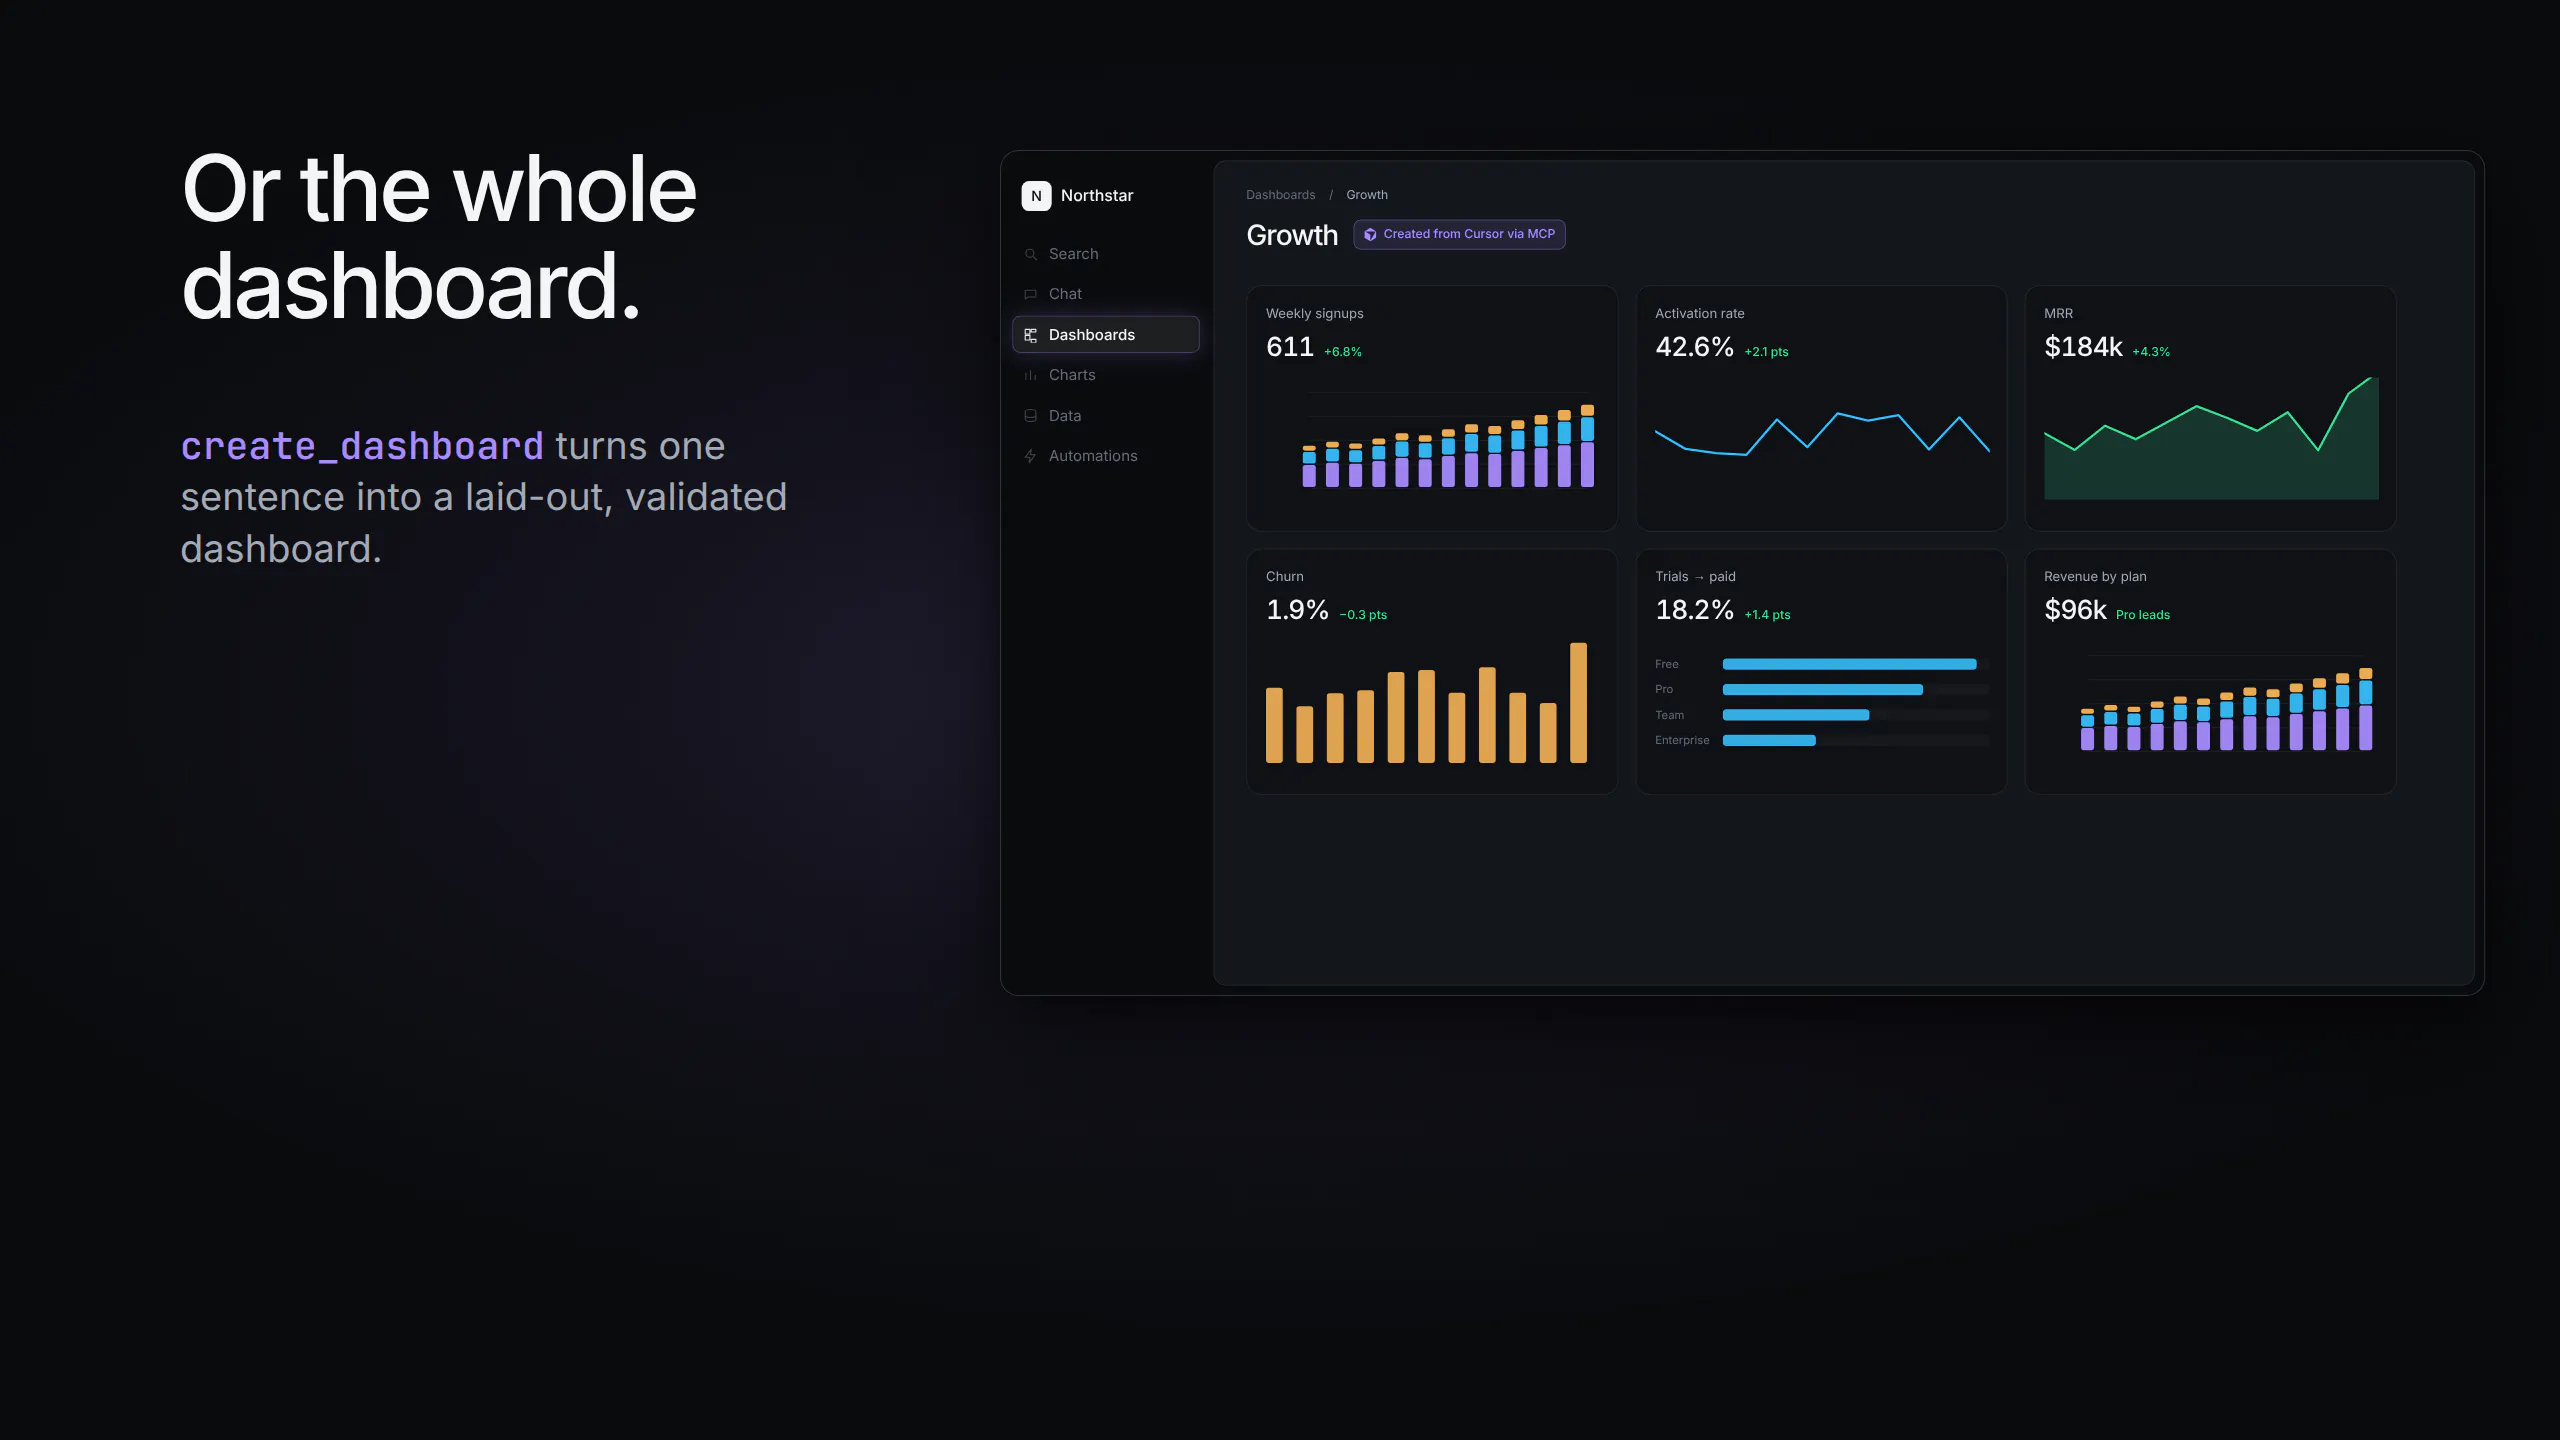
Basedash MCP Write revolutionizes the way developers and data teams create visualizations by enabling natural language-driven chart and dashboard generation. Integrating seamlessly with Cursor, Claude, or any MCP client, users can simply ask for a specific chart or dashboard, and Basedash automatically explores the database schema, writes and validates SQL queries, selects appropriate visualizations, and lays out the final product. The generated charts are interactive, shareable via durable links, and can be refined directly within the IDE, promoting a rapid, iterative workflow. This tool is ideal for teams that want to streamline data visualization processes, reduce manual coding, and enhance collaboration through quick, AI-powered insights. Its ability to both read and write makes it stand out in the landscape of data visualization tools, offering a truly dynamic and user-friendly experience for technical and non-technical users alike.
Screenshots

Pros
- ✓Natural language interface for chart and dashboard creation
- ✓Automates SQL writing and validation
- ✓Supports iterative editing and sharing
- ✓Integrates with popular MCP clients like Cursor and Claude
- ✓Facilitates rapid data visualization workflows
Cons
- ✗Limited information on pricing and plans
- ✗Potential learning curve for complex schema exploration
- ✗May depend on the capabilities of underlying MCP clients
Use Cases
Pricing
Pricing not verified

Similar Tools in AI Image & Design




Embed Badge
Add this badge to your website to show that Basedash MCP write is featured on Visalytica.
<a href="https://www.visalytica.com/tool/basedash-mcp-write" target="_blank" rel="noopener noreferrer" style="display:inline-flex;align-items:center;gap:6px;padding:6px 14px;background:#7c3aed;color:#fff;border-radius:8px;font-family:-apple-system,system-ui,sans-serif;font-size:13px;font-weight:600;text-decoration:none;transition:background .2s" onmouseover="this.style.background='#6d28d9'" onmouseout="this.style.background='#7c3aed'"><svg width="14" height="14" viewBox="0 0 24 24" fill="none" stroke="currentColor" stroke-width="2.5" stroke-linecap="round" stroke-linejoin="round"><path d="M12 20V10"/><path d="M18 20V4"/><path d="M6 20v-4"/></svg>Featured on Visalytica</a>