
Autoplot
Unify data analysis and plotting in one powerful workspace
About Autoplot
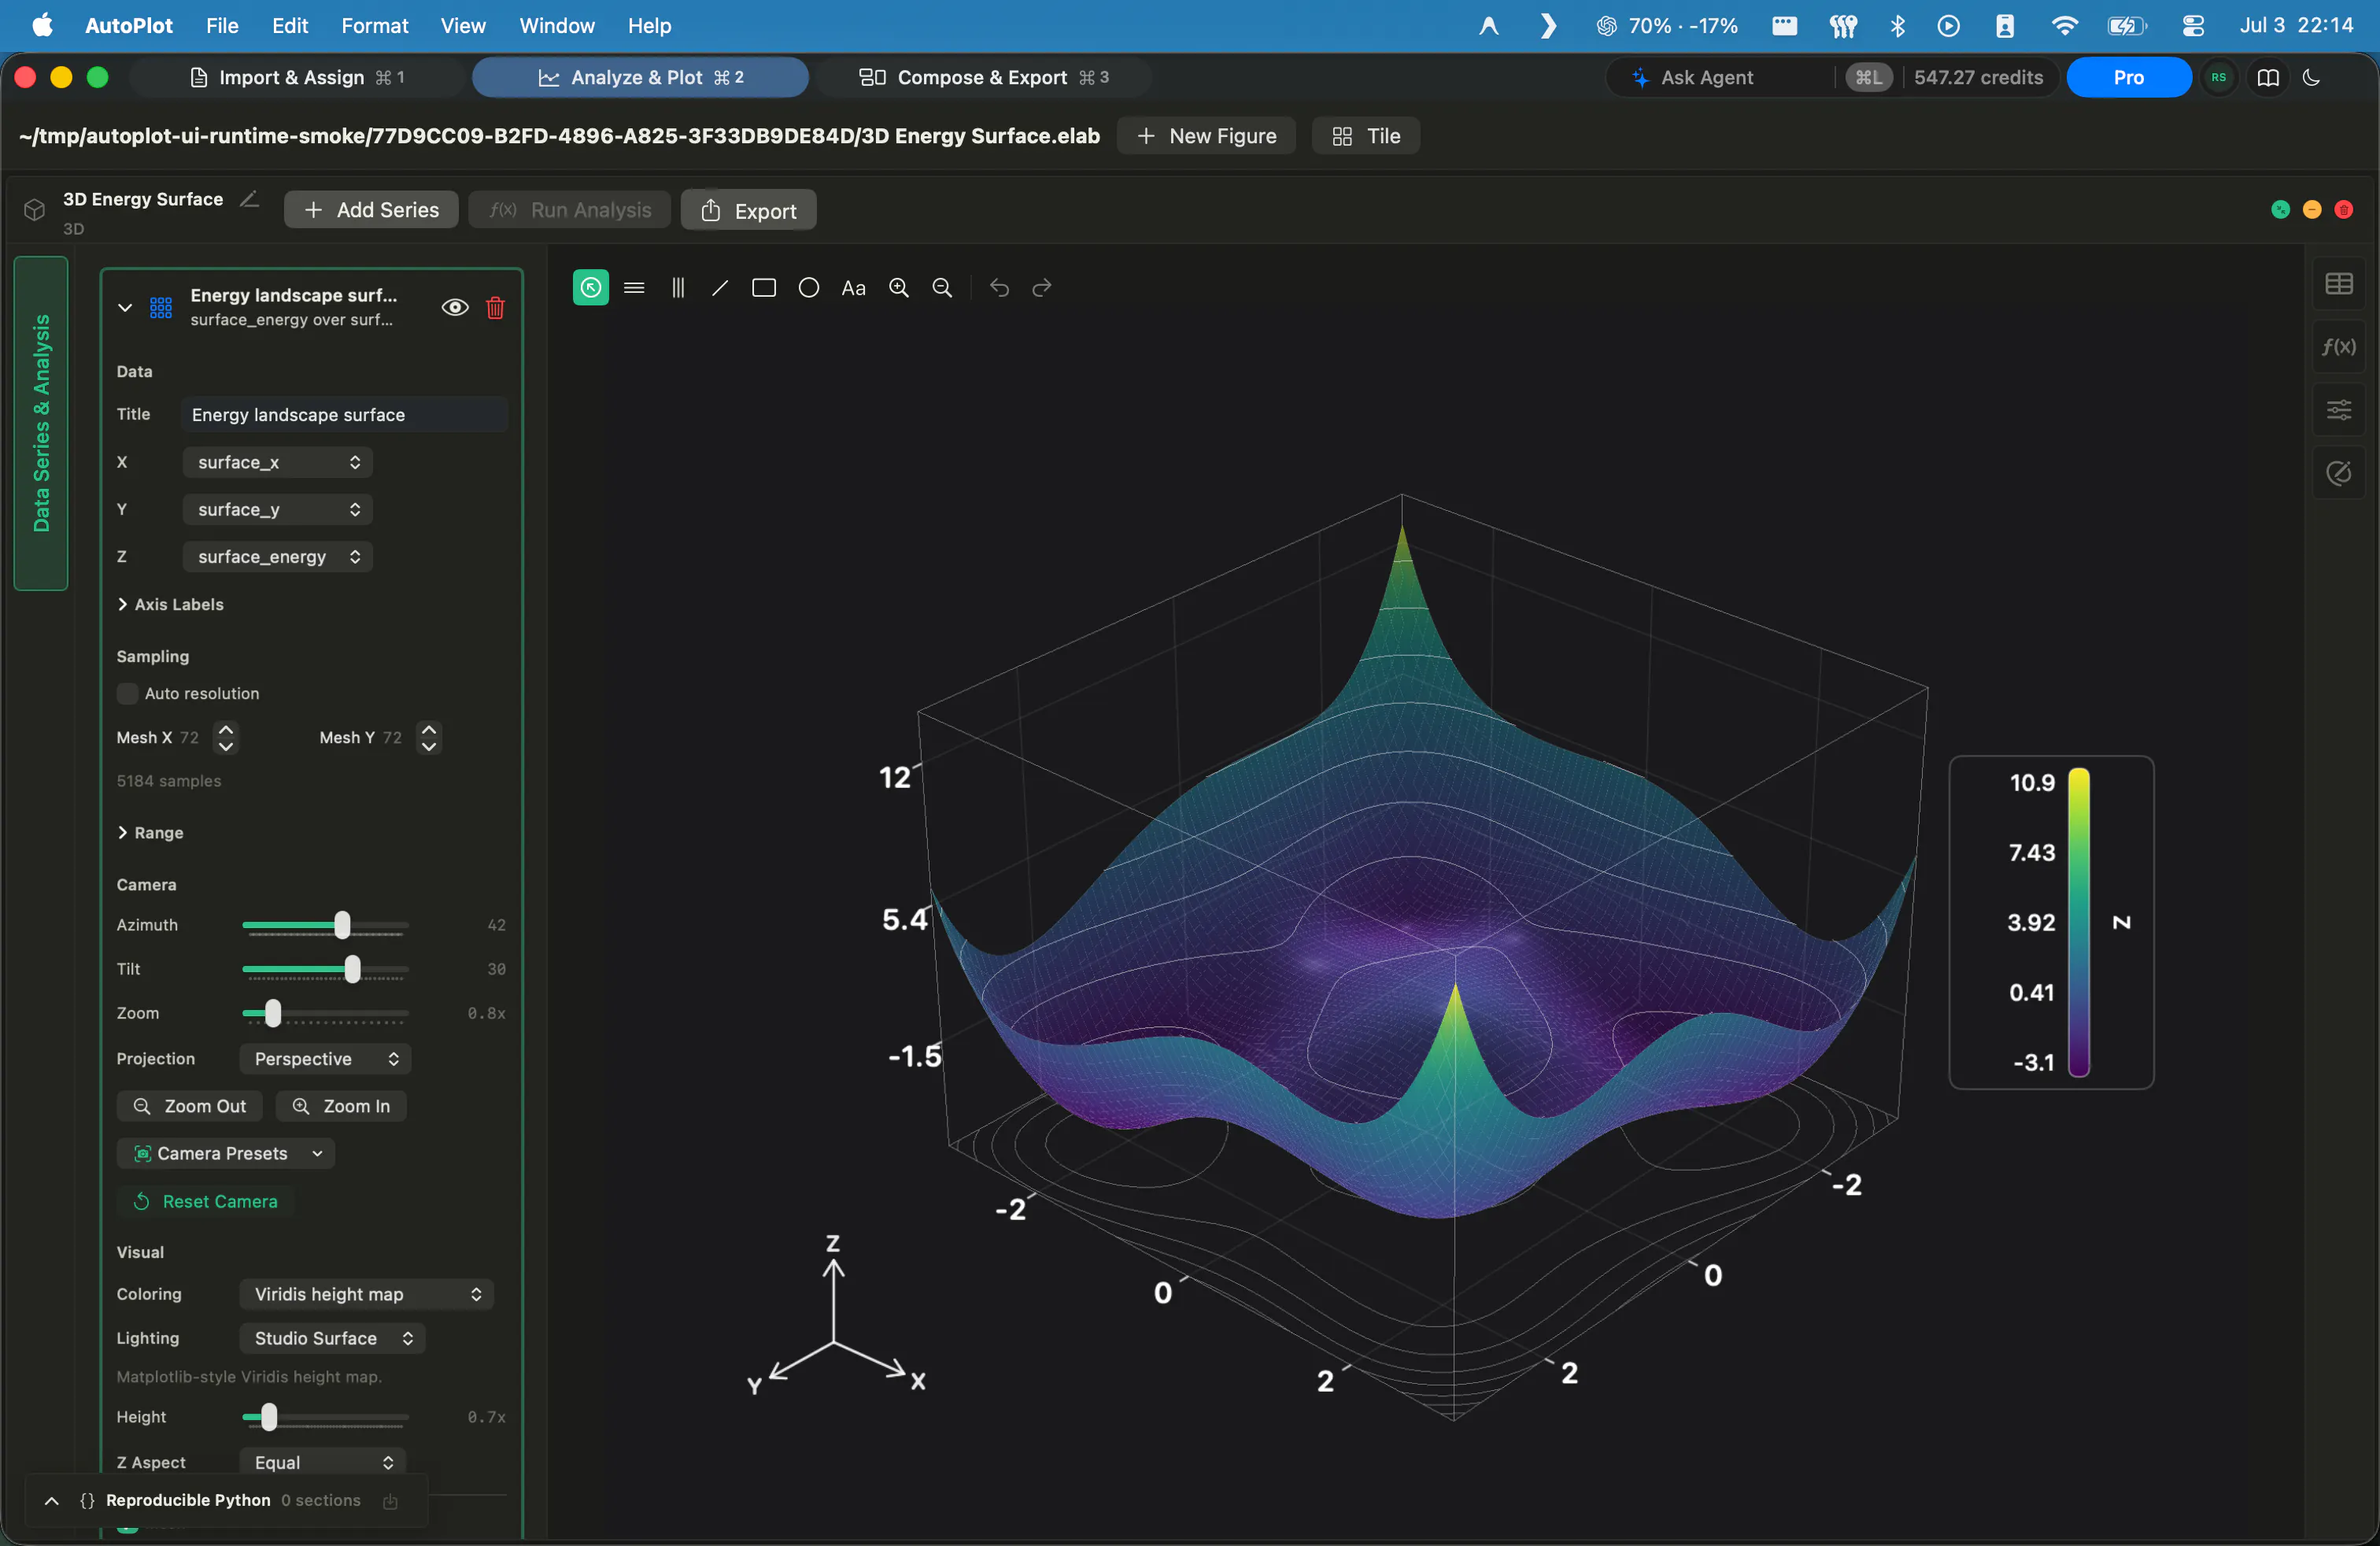
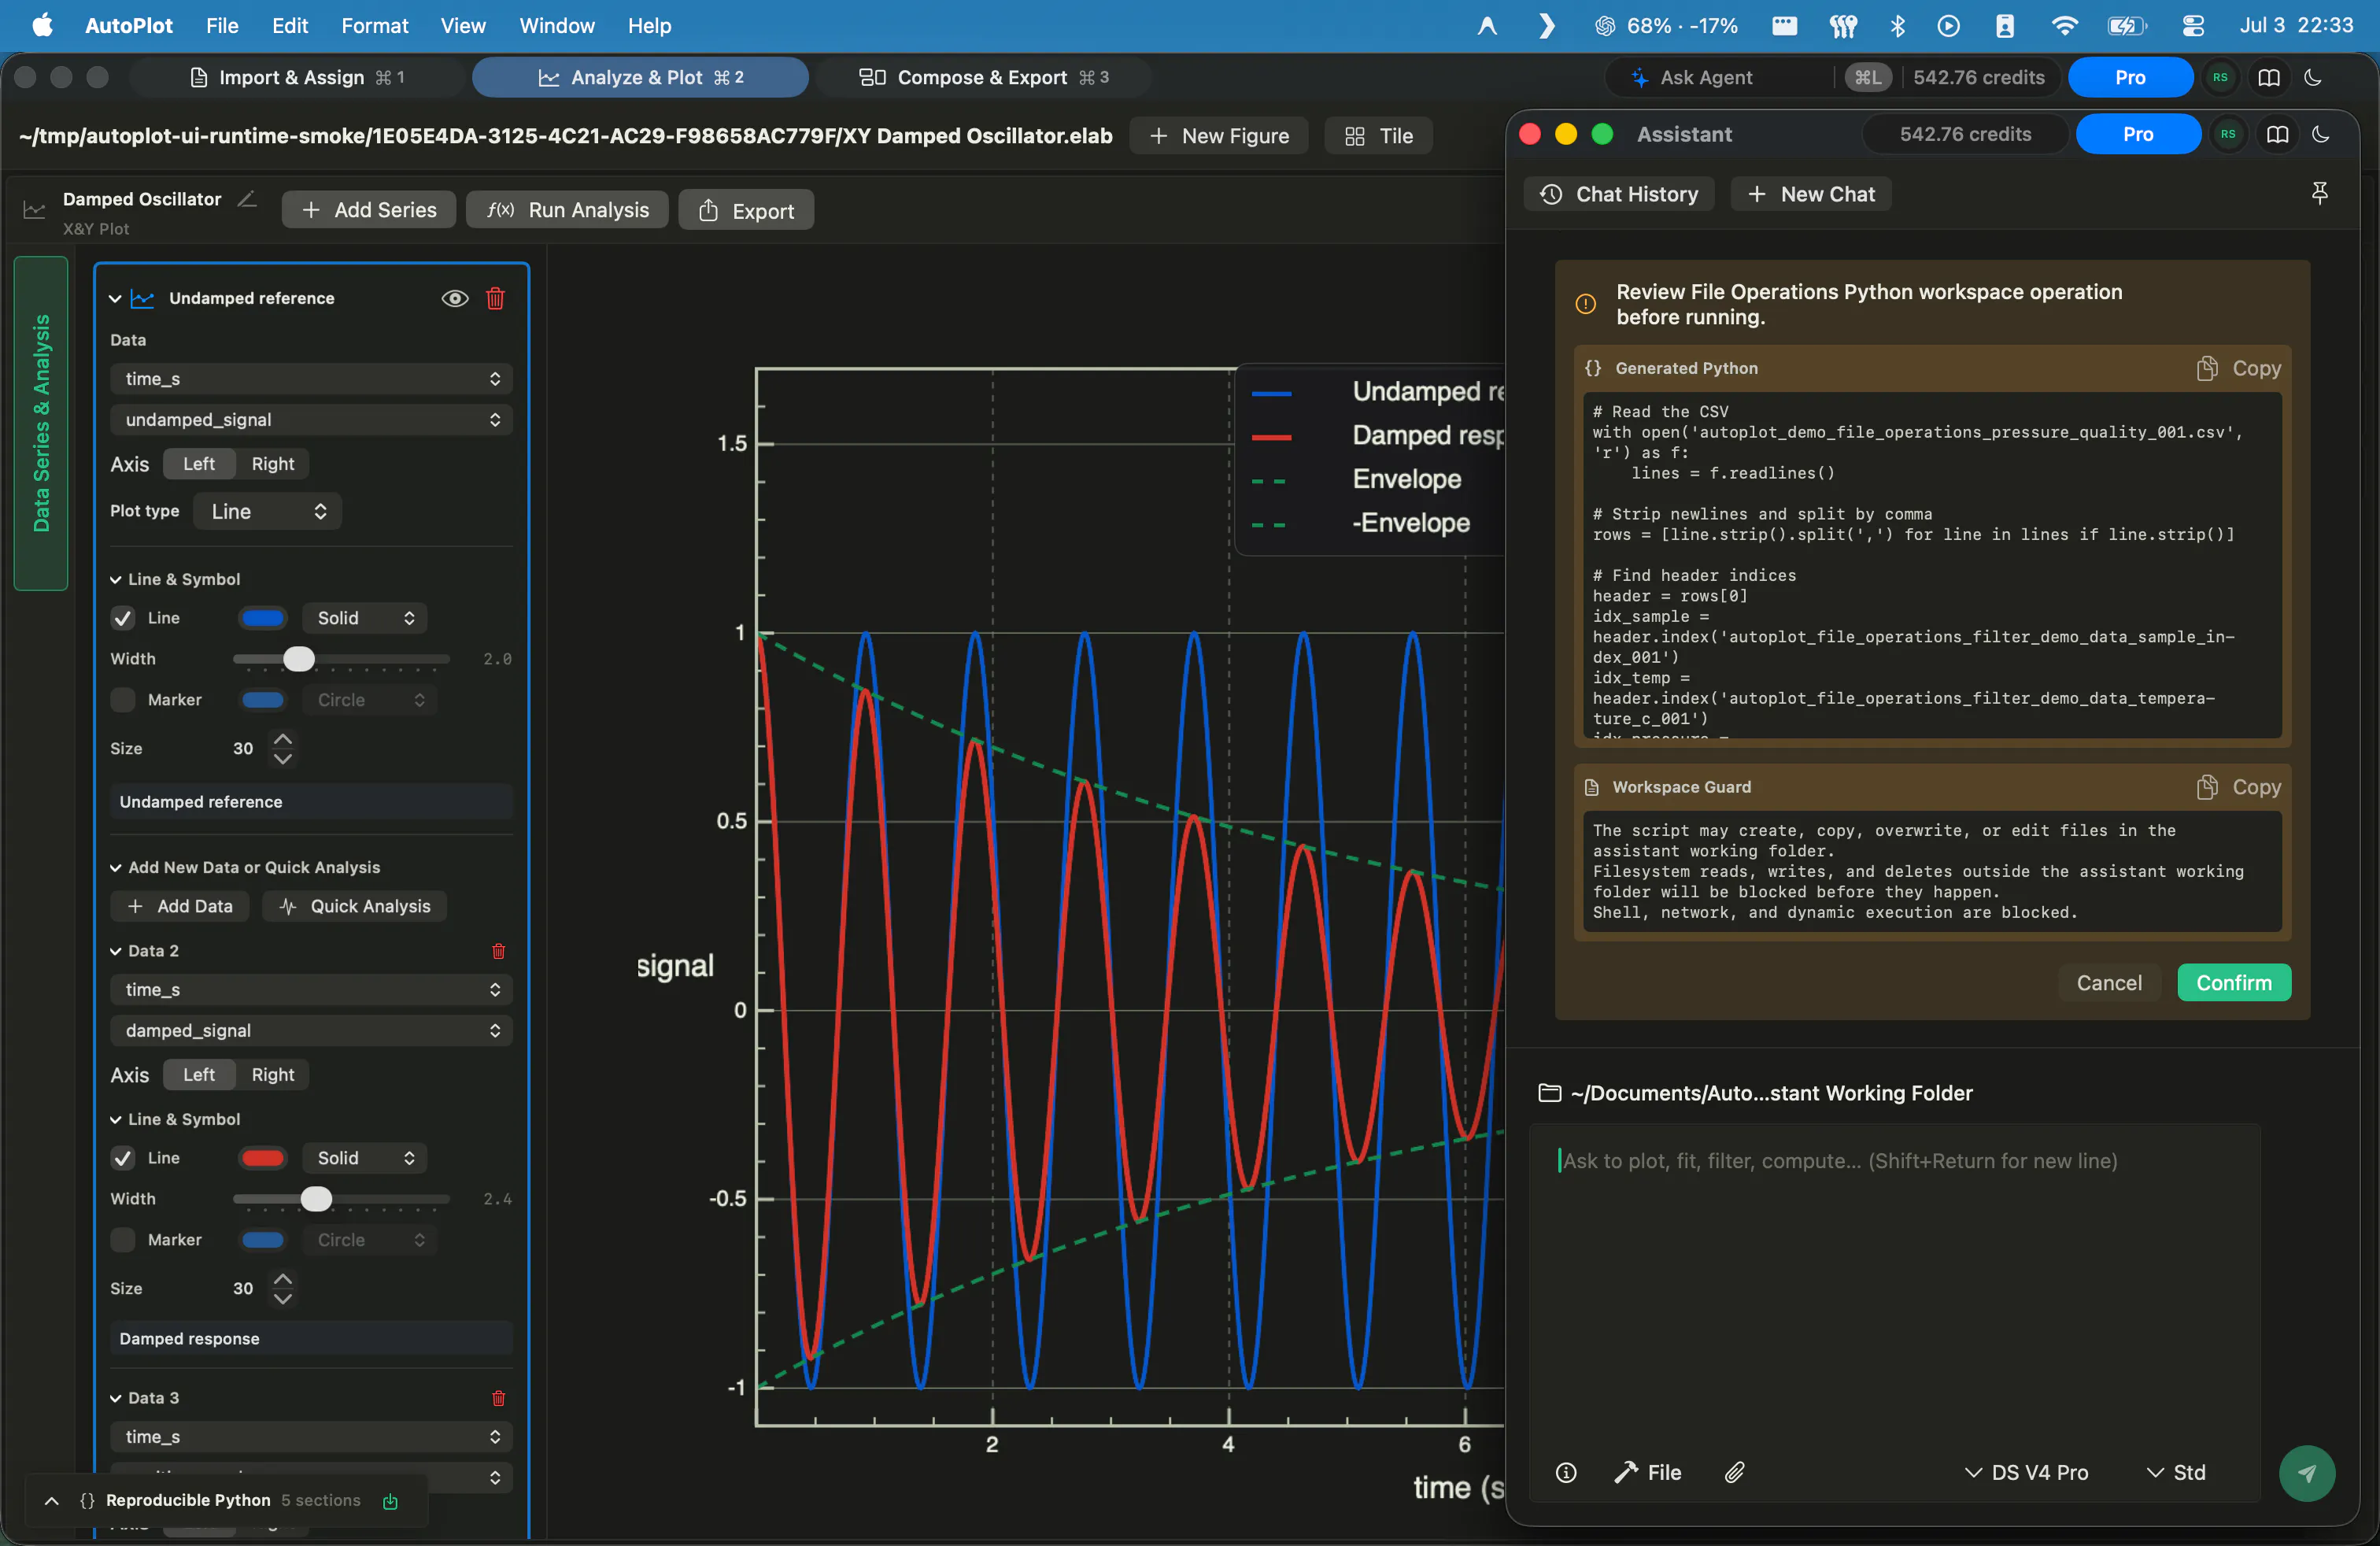
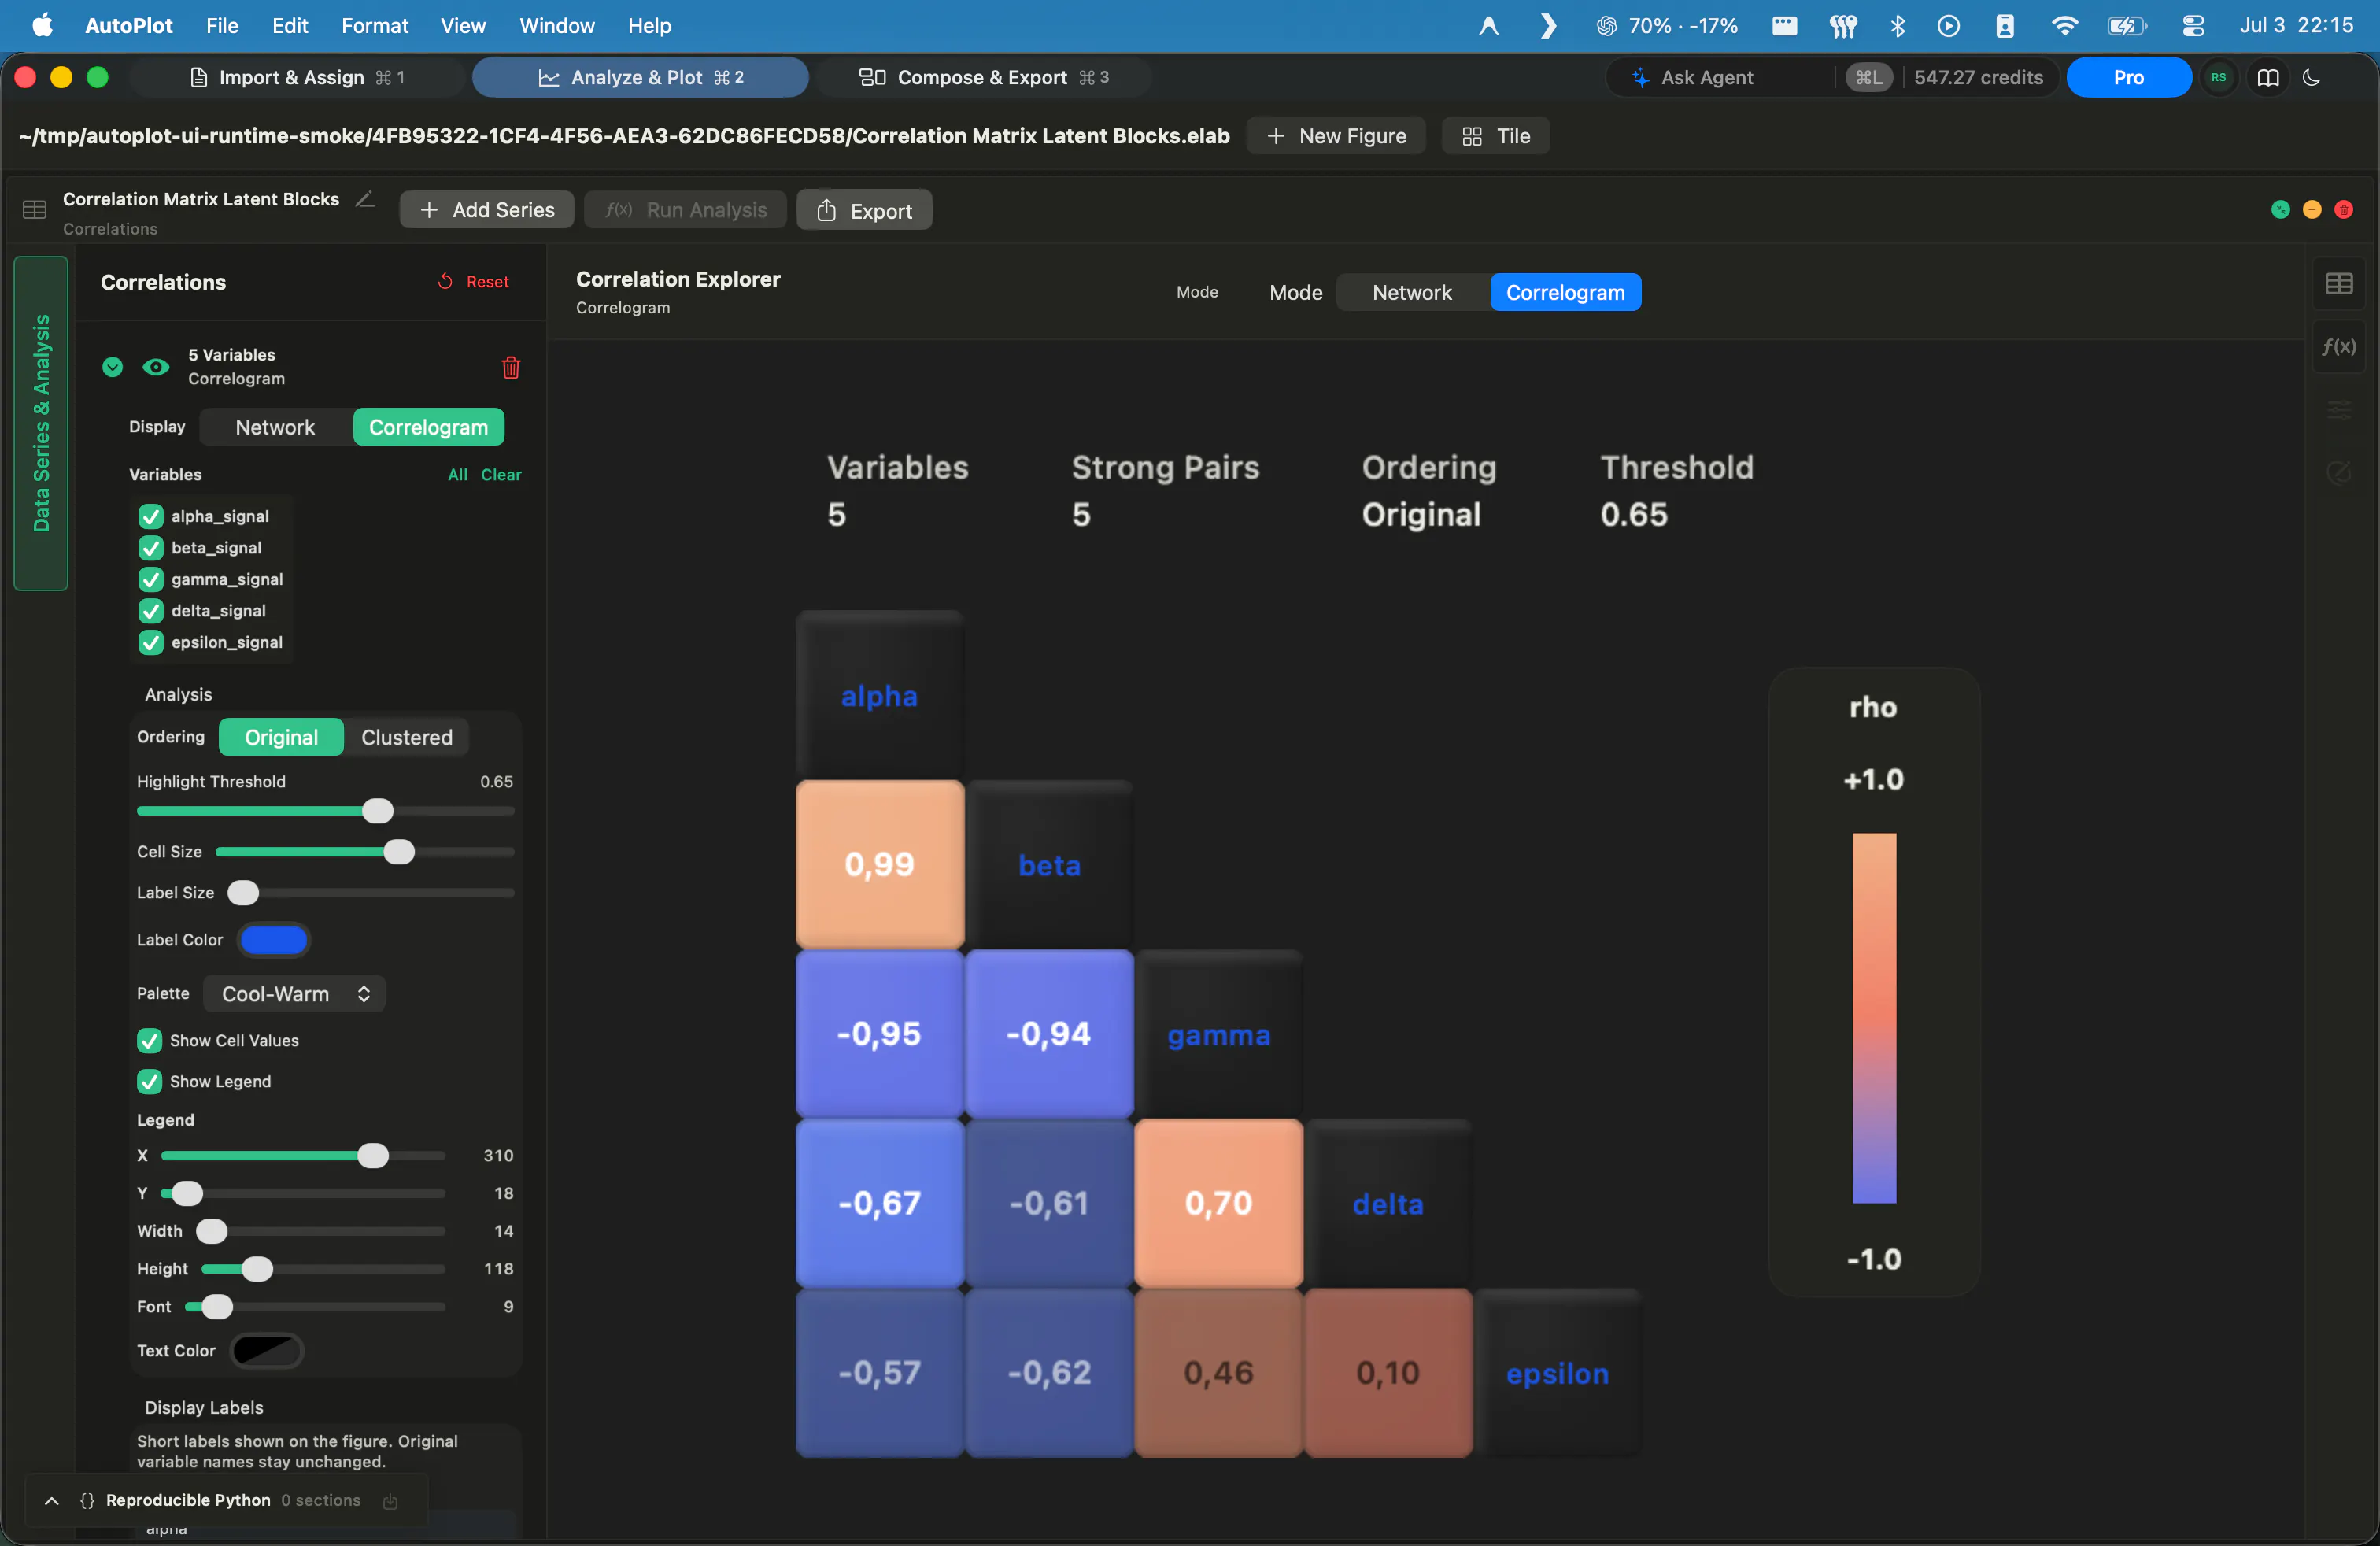
AutoPlot is a powerful native macOS application designed for scientific data analysis and visualization. It offers an integrated workspace where users can import tabular datasets, create a variety of plots including X&Y graphs, histograms, heat maps, and 3D visualizations. Its advanced features include running fits, building correlation networks, and composing publication-quality figures with vector exports. Utilizing Metal-backed GPU rendering, AutoPlot ensures smooth, interactive exploration of large datasets—allowing users to rotate, zoom, and re-fit visualizations in real-time without lag. This combination of high-performance rendering and comprehensive analytical tools makes it ideal for researchers, data scientists, and analysts who value data privacy and seamless workflows on macOS. With Raw data staying on the local machine, AutoPlot emphasizes security and speed, making it a compelling choice for scientific and exploratory data analysis on Mac environments.
Screenshots
Pros
- ✓High-performance GPU rendering enabling smooth interaction with large datasets
- ✓All-in-one workspace for data import, analysis, visualization, and figure composition
- ✓Supports a wide variety of plot types, including 3D and heat maps
- ✓Data remains local, ensuring privacy and security
- ✓Vector export for publication-quality figures
Cons
- ✗Limited information on pricing or subscription details
- ✗Mac-only application, restricting cross-platform use
- ✗May have a learning curve for beginners due to its advanced features
Use Cases
Pricing
Likely a paid application with a one-time purchase or subscription model, given its professional focus and native Mac support. Exact pricing details are not specified, but such tools typically range from $50 to $200.
Quick Info
Topics
Makers

Lale
Similar Tools in Data & Analytics




Embed Badge
Add this badge to your website to show that Autoplot is featured on Visalytica.
<a href="https://www.visalytica.com/tool/autoplot" target="_blank" rel="noopener noreferrer" style="display:inline-flex;align-items:center;gap:6px;padding:6px 14px;background:#7c3aed;color:#fff;border-radius:8px;font-family:-apple-system,system-ui,sans-serif;font-size:13px;font-weight:600;text-decoration:none;transition:background .2s" onmouseover="this.style.background='#6d28d9'" onmouseout="this.style.background='#7c3aed'"><svg width="14" height="14" viewBox="0 0 24 24" fill="none" stroke="currentColor" stroke-width="2.5" stroke-linecap="round" stroke-linejoin="round"><path d="M12 20V10"/><path d="M18 20V4"/><path d="M6 20v-4"/></svg>Featured on Visalytica</a>