132 Canvas
Turn Google Sheets into process flows and product diagrams
About 132 Canvas
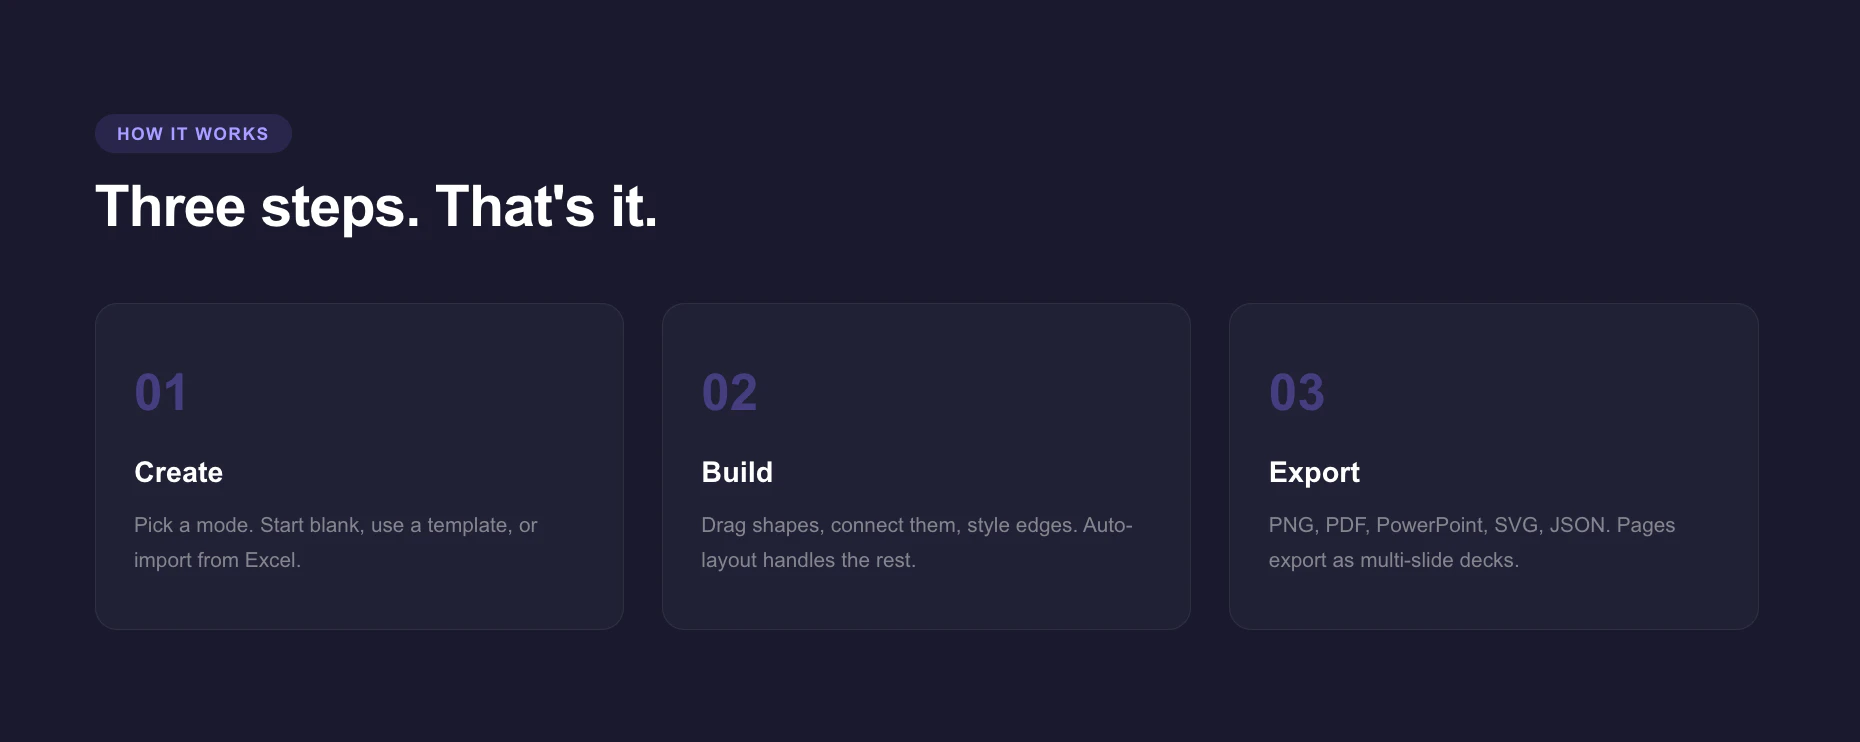
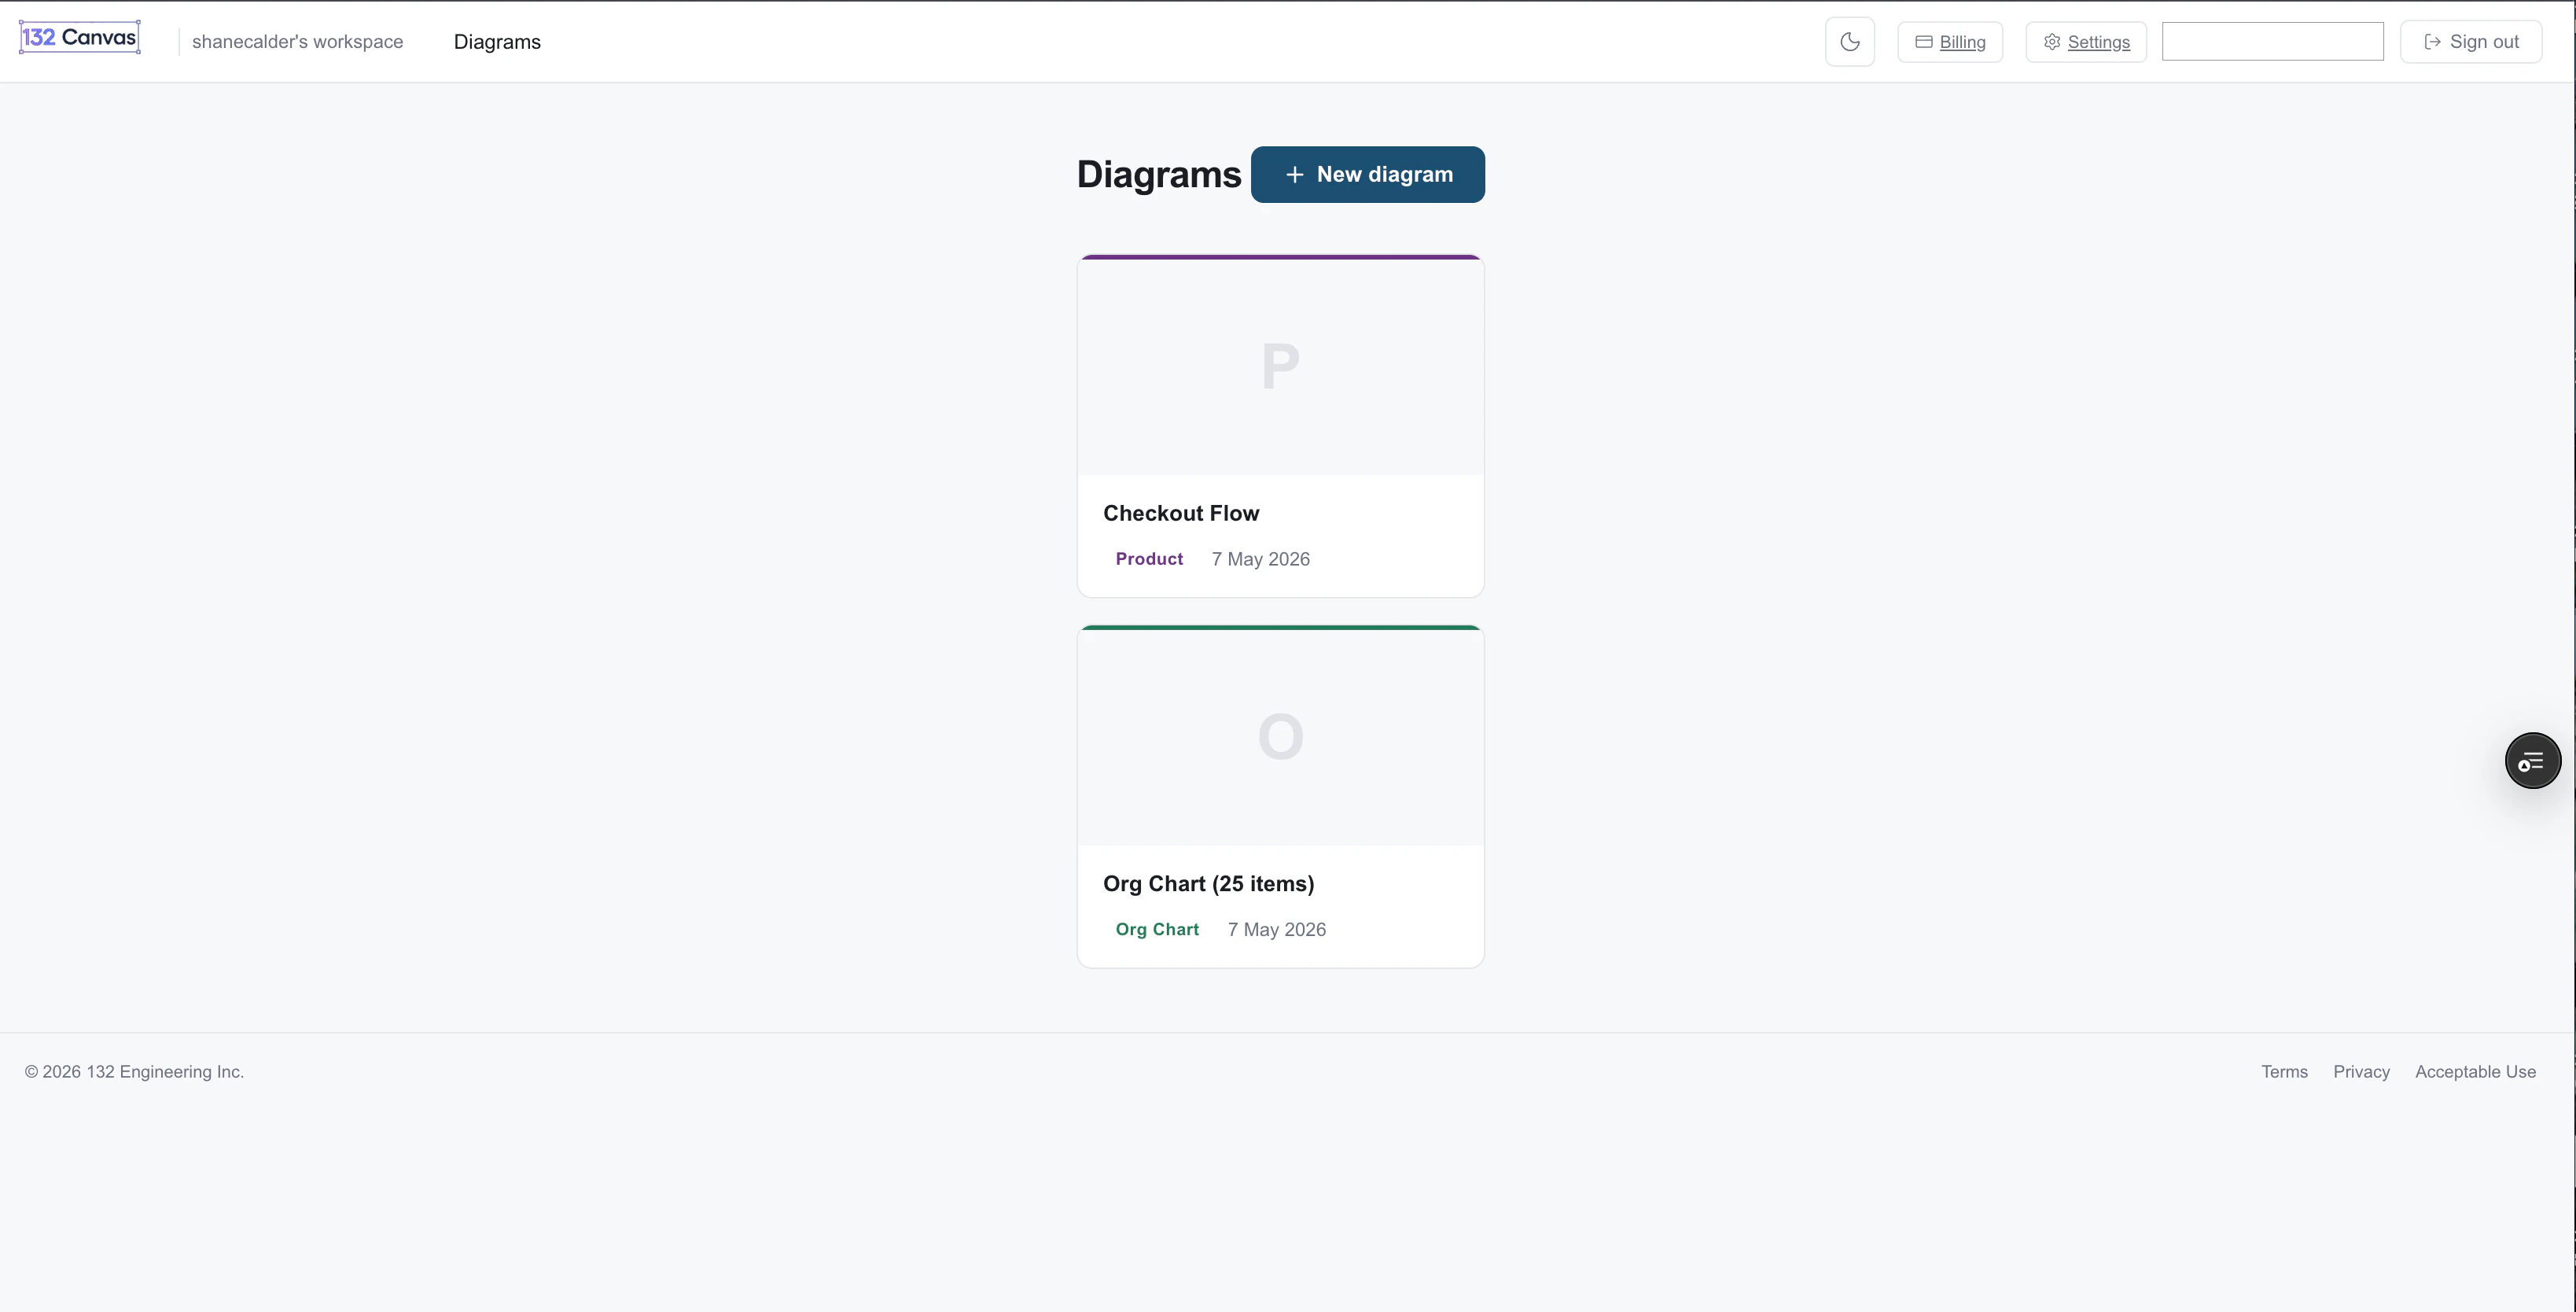
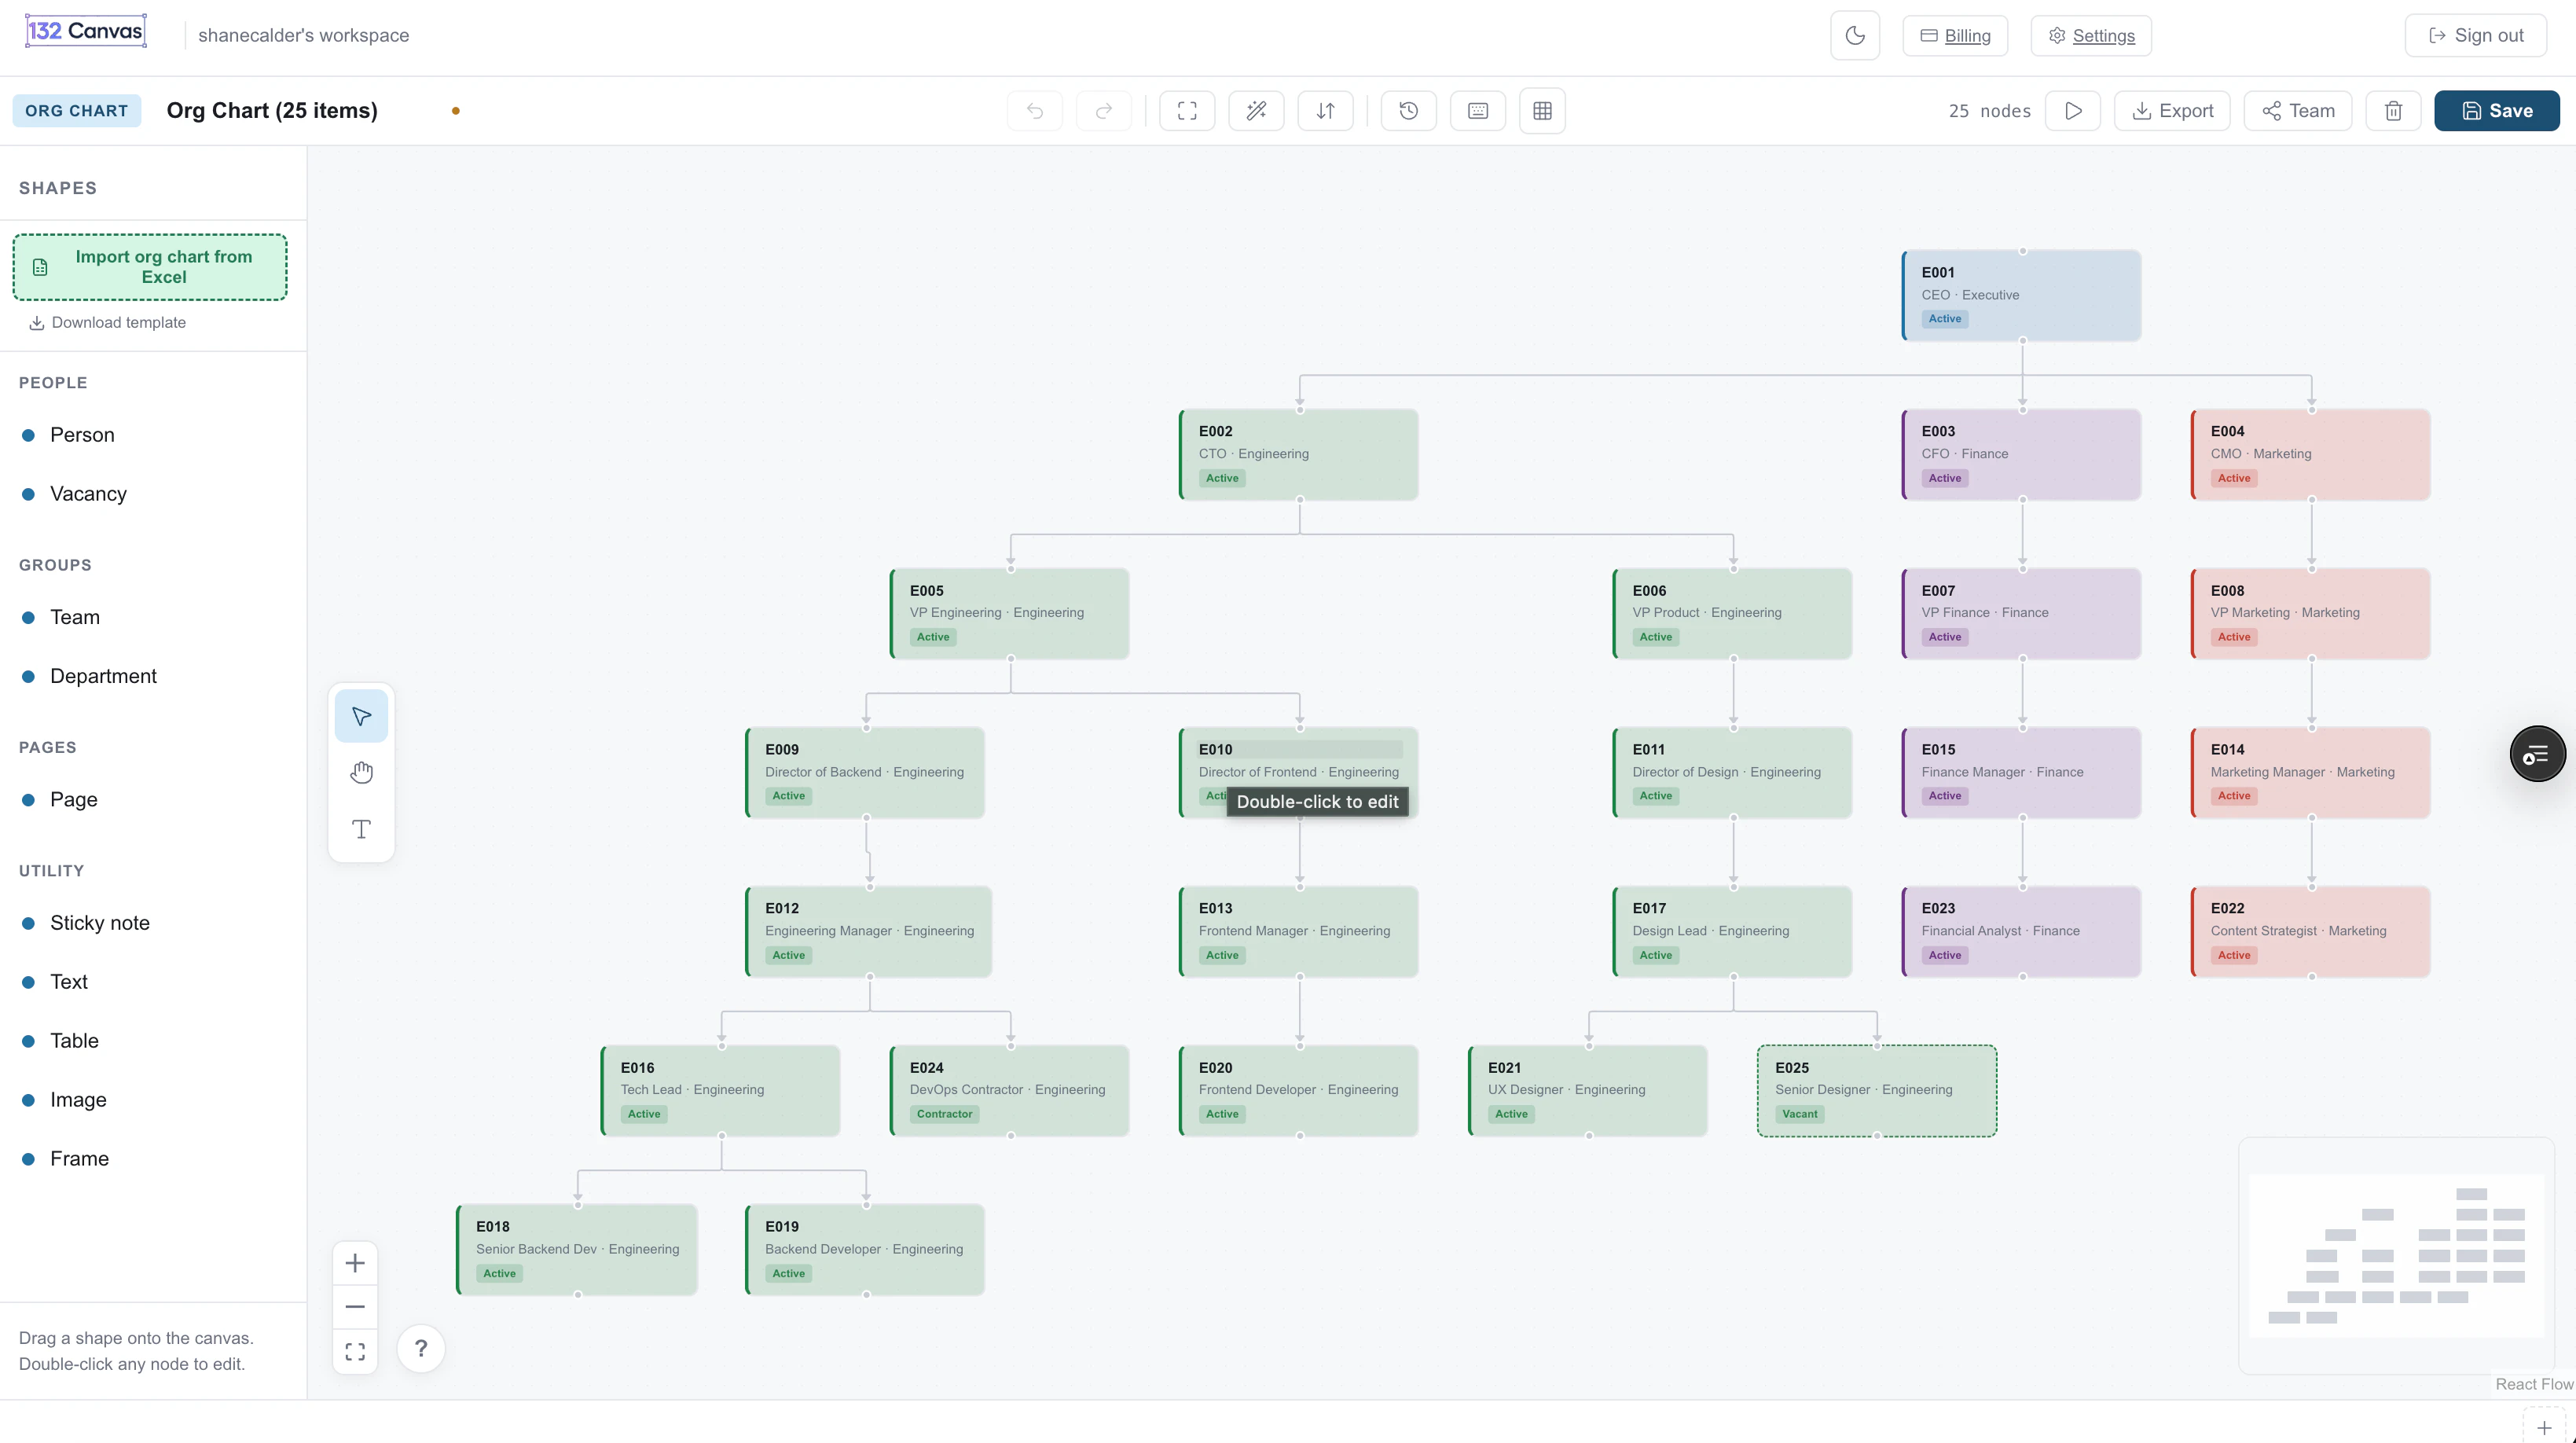
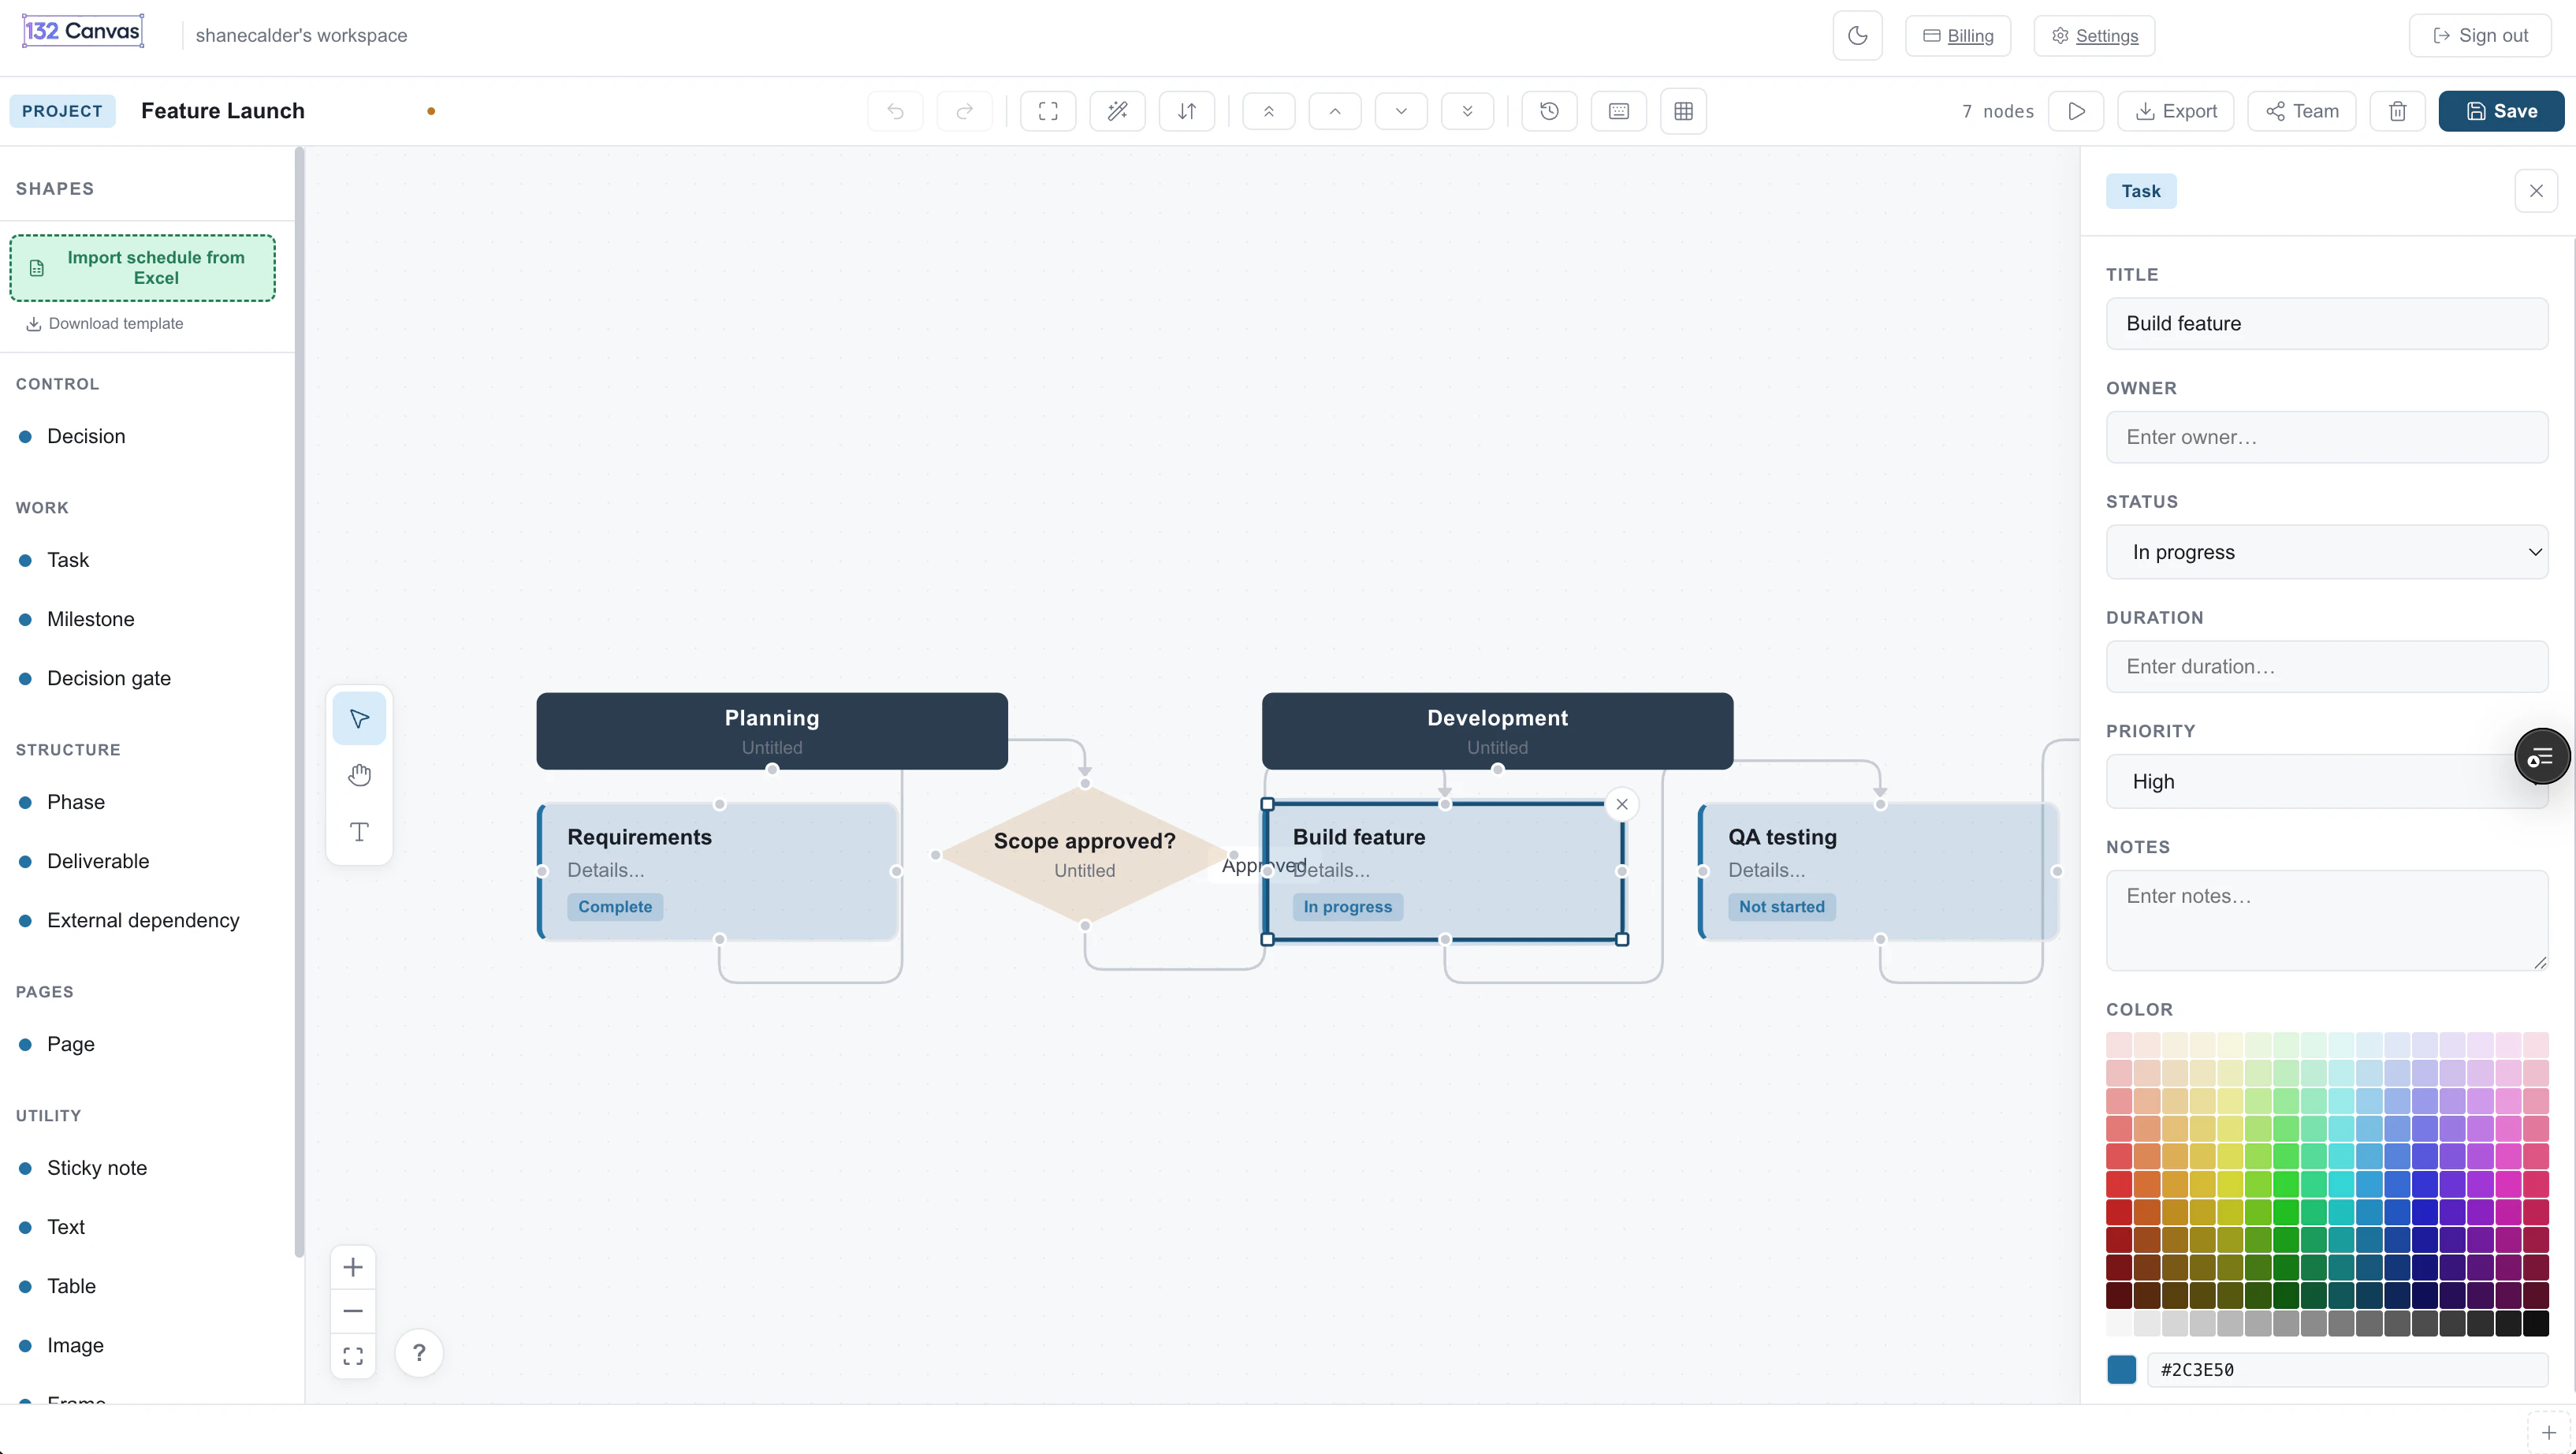
132 Canvas is an innovative SaaS tool designed for teams and individuals looking to transform spreadsheet data into clear, visual process flows and diagrams. By importing data from Google Sheets or Excel, users can effortlessly generate professional diagrams such as process flows, org charts, and project visuals, streamlining communication and planning. Its ability to export diagrams to PowerPoint, PDF, or PNG makes sharing and presentation seamless, fostering collaboration across teams. The platform’s low cost of $5 per month per editor offers an accessible entry point for startups, project managers, product teams, and business analysts seeking a straightforward way to visualize complex data. What sets 132 Canvas apart is its focus on simplicity and integration, allowing users to leverage existing spreadsheet data without complex design skills. This makes it especially appealing for teams aiming to enhance their productivity and clarity in project workflows without investing in expensive or complicated diagramming tools.
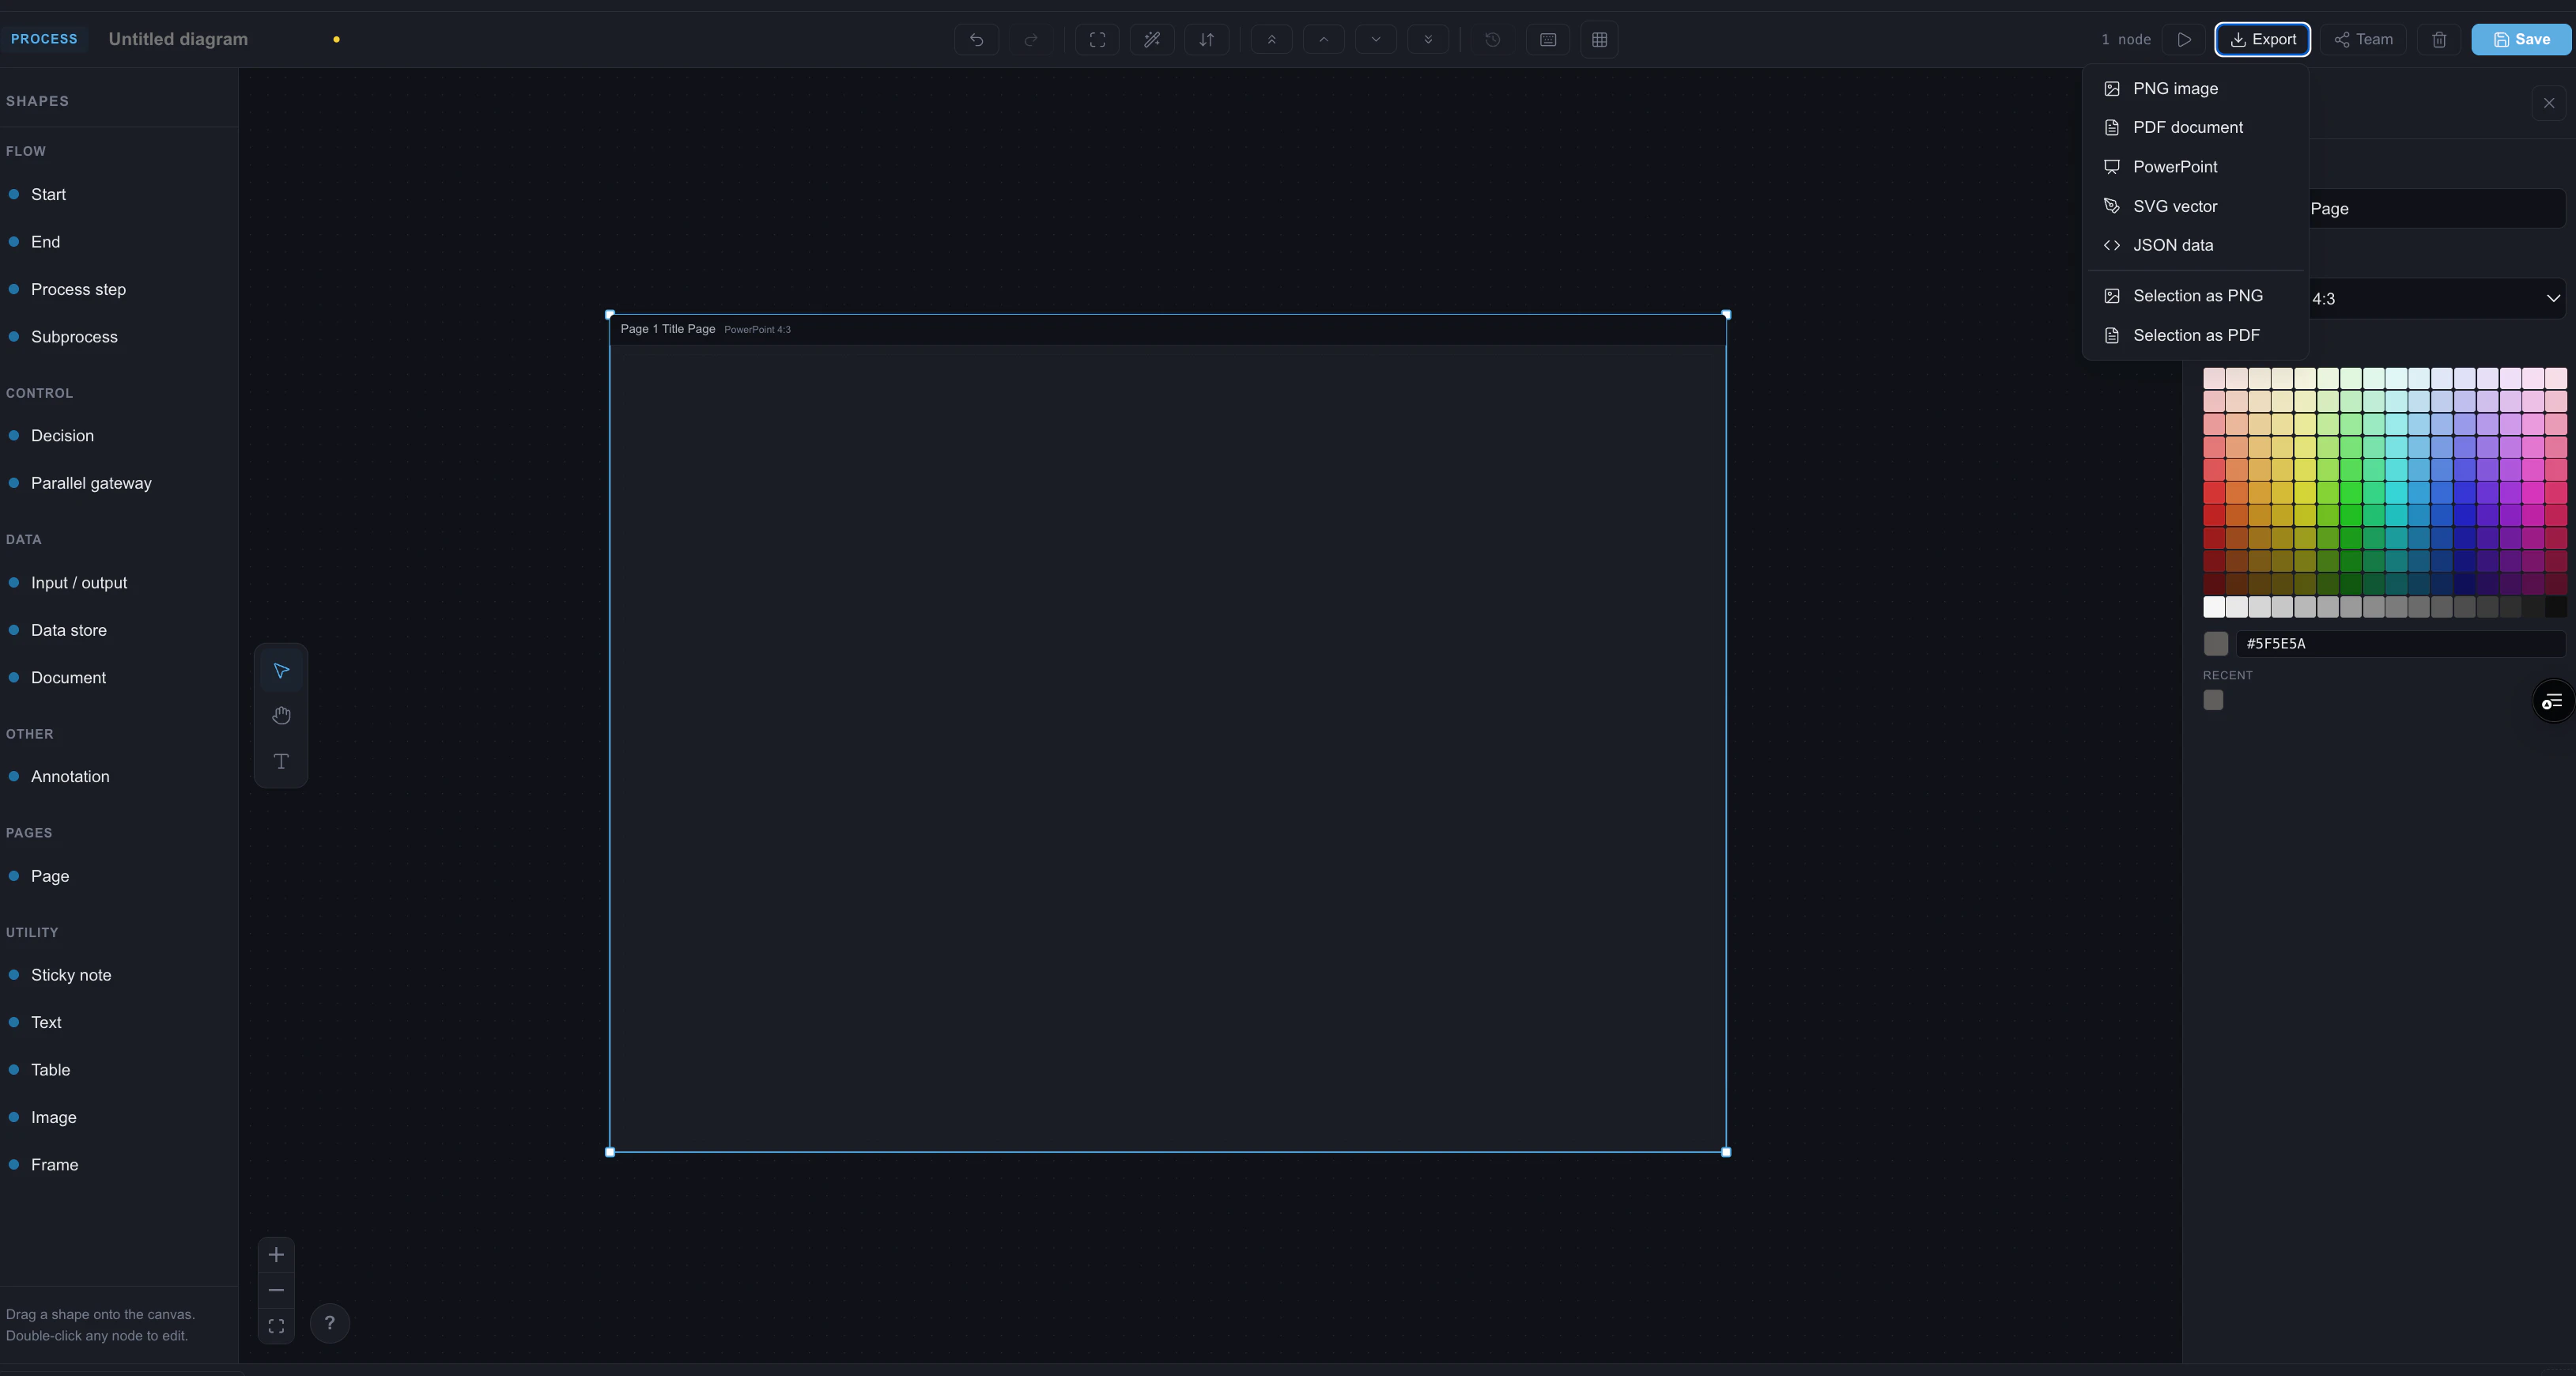
Screenshots
Pros
- ✓Easy import from Google Sheets and Excel, saving time
- ✓Multiple export options including PowerPoint, PDF, and PNG
- ✓Affordable pricing at $5/month per editor
- ✓User-friendly interface suitable for non-designers
- ✓Supports collaboration and team sharing
Cons
- ✗Limited advanced diagram customization options
- ✗Features may be basic compared to dedicated diagramming tools
- ✗No free tier or trial available for new users
Use Cases
Pricing
Likely operates on a subscription model at $5 per month per user or editor, with no free tier mentioned. The focus appears to be on affordability for small teams and startups, with straightforward monthly billing.
Quick Info
Topics
Makers
Shanecalder
Alternatives
Similar Tools in AI Image & Design
Embed Badge
Add this badge to your website to show that 132 Canvas is featured on Visalytica.
<a href="https://www.visalytica.com/tool/132-canvas" target="_blank" rel="noopener noreferrer" style="display:inline-flex;align-items:center;gap:6px;padding:6px 14px;background:#7c3aed;color:#fff;border-radius:8px;font-family:-apple-system,system-ui,sans-serif;font-size:13px;font-weight:600;text-decoration:none;transition:background .2s" onmouseover="this.style.background='#6d28d9'" onmouseout="this.style.background='#7c3aed'"><svg width="14" height="14" viewBox="0 0 24 24" fill="none" stroke="currentColor" stroke-width="2.5" stroke-linecap="round" stroke-linejoin="round"><path d="M12 20V10"/><path d="M18 20V4"/><path d="M6 20v-4"/></svg>Featured on Visalytica</a>